








AUD/USD, AUD/NZD Outlook: Trump–Xi Talks Spark USD Headwinds, Yen Strength
The Australian dollar (AUD/USD) tests key resistance as Trump–Xi tensions hit USD sentiment. AUD/NZD stabilises; JPY gains on safe-haven demand.
Share this:

View related analysis:
View related analysis:
- So how good is APD at predicting NFP, anyway?
- AUD/JPY, GBP/JPY Outlook: Yen Slips as Trade Talk Optimism Boosts Risk Appetite
- Nasdaq 100 Futures Eye ATH as Wall Street Awaits Trade Headlines
- AUD/USD, NZD/USD Outlook: US Dollar Slides as Tariff Risks Resurface
Sentiment reversed again on Wednesday, a pattern we have become accustomed to almost daily. Though this time risk appetite was lower after President Trump took to Trush Social, accusing Xi Jinping “VERY TOUGH, AND EXTREMELY HARD TO MAKE A DEAL WITH!!!”. Trump also took aim at the Federal Reserve (Fed) following a weak ADP payrolls print, urging Powel to “now LOWER THE RATE. He is unbelievable!!!”.
To be fair, the ADP print of 37k was its slowest jobs growth since March 2023. Though it is worth remembering that ADP is a terrible predictor of the upcoming nonfarm payrolls figure.
The usual ‘tariffs bad’ playbook ensued for currency traders.
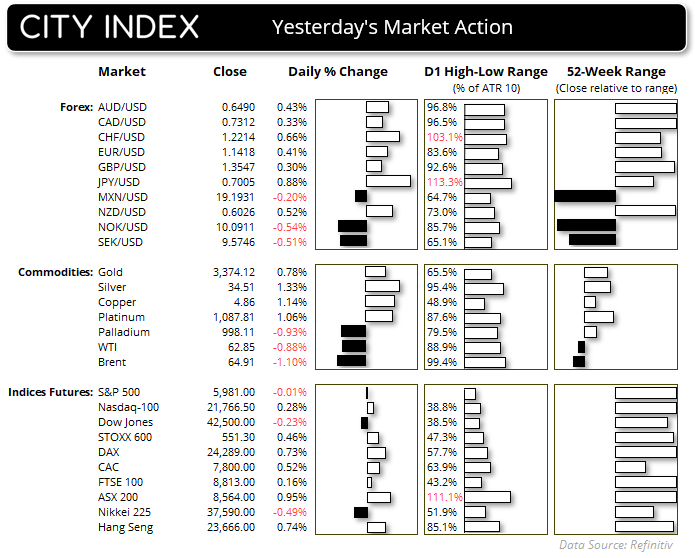
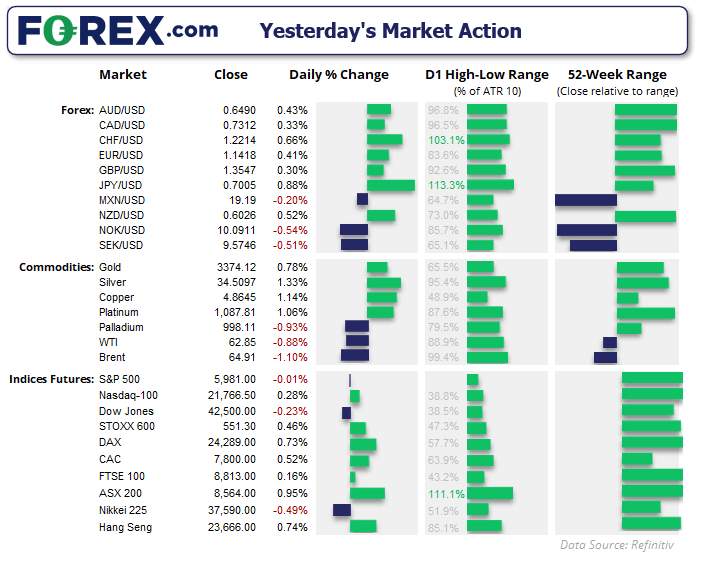
- The US dollar (USD) was the weakest FX major, seeing the USD index hand back most of Wednesday’s gains though prices are holding above the December low.
- The Japanese yen (JPY) and Swiss franc (CHF) were broadly higher against FX majors as they sucked in safe-haven flows, though CHF/JPY was also lower to show the yen was the dominant safety play
- USD/JPY and USD/CHF parred most of Wednesday’s gains, retaining the potential for a break of key support levels
- AUD/USD has tapped 65c once more, though this is an area that has repeatedly delivered false breaks and bearish reversals in recent weeks.
- While the Canadian dollar achieved its mildest gains among commodity FX, USD/CAD still fell to an 8-month low and invalidated its 2021, bullish trendline.
AUD/USD Technical Analysis: Australian Dollar vs US Dollar
The Australian dollar continues to reflect the twists and turns of Trump’s trade war, with AUD/USD charting a clear V-bottom recovery following previously-paused tariffs — only to settle into a tight sideways range since late April.
Recently, AUD/USD has been confined to a 0.64–0.65 range, with resistance forming near the highs and support near the lows. Once again, the Australian dollar is teasing the 65c level, and price action suggests traders are waiting on the next big trade headline — particularly regarding US-China negotiations.
Should we get a risk-off outcome from the latest trade talks, AUD/USD appears vulnerable to another leg lower. The downside case is made more compelling given the increased likelihood of a further rate cut from the Reserve Bank of Australia (RBA), especially after this week’s weaker-than-expected GDP report.
AUD/NZD Technical Analysis: Australian Dollar vs New Zealand Dollar
While on track for its third consecutive weekly decline, AUD/NZD is showing signs the Australian dollar may be ready to rebound against the New Zealand dollar over the near term. If the week closes around current levels, a spinning top doji will form, supported by the June low — a potentially bullish signal for AUD/NZD traders.
The daily chart shows a two-bar bullish reversal pattern known as a Piercing Line, and Thursday’s range held within the top half of Wednesday’s bullish candle. The daily RSI (2) also reached oversold territory on Wednesday, suggesting a short-term bounce may be due for the Australian dollar.
The bias is for a minor rally towards the 1.08–1.0815 area. A break above that level could bring the May VPOC (volume point of control) at 1.0836 into focus for AUD/NZD bulls seeking further upside against the New Zealand dollar.
Economic Events in Focus (AEST / GMT+10)
We have quite a packed calendar today with many data points potentially revealing cracks in trade relations and market sentiment.
Trade balance data from April is released for Australia and Canada, with the Canadian IVEY PMI report for May also being released with commodity prices for New Zealand. That could provide some volatility for commodity FX pairs (AUD/USD, NZD/USD, USD/CAD and their respective crosses).
The European Central Bank (ECB) are expected to cut their interest rate by 25bp today, with markets pricing it in with a 95% certainty. The focus is therefore on forward guidance and the ECB’s appetite for further cuts.
Keep an eye on challenger job cuts in light of the weak ADP payrolls figures on Friday, as this could further weigh on the USD.
Japan’s 30-year JGB auction also warrants a look given the very low levels of demand at the recent 20-year auction, which forced yields higher and sparked another bout of risk off on bets of Bank of Japan (BOJ) having to support the bond market.
- 09:30: JPY Overall Wage Income, Overtime Pay (Apr) (USD/JPY, EUR/JPY, Nikkei 225)
- 09:50: JPY Foreign Bond Buying, Foreign Stock Investment (USD/JPY, EUR/JPY, Nikkei 225)
- 11:00: NZD ANZ Commodity Price Index (NZD/USD, AUD/NZD)
- 11:30: AUD Exports, Imports, Trade Balance (Apr) (AUD/USD, ASX 200, AUD/JPY)
- 13:35: JPY 30-Year JGB Auction (USD/JPY, Nikkei 225)
- 14:20: CAD BoC Deputy Gov Kozicki Speaks (USD/CAD, CAD/JPY, TSX)
- 15:45: CHF Unemployment Rate (May) (USD/CHF, CHF/JPY, EUR/CHF)
- 16:00: EUR German Factory Orders (Apr) (EUR/USD, EUR/GBP, DAX)
- 18:30: GBP BoE Breeden Speaks, S&P Global Construction PMI (May) (GBP/USD, GBP/JPY, EUR/GBP, FTSE 100)
- 19:00: EUR PPI (Apr) (EUR/USD, EUR/GBP, EUR/JPY)
- 21:30: USD Challenger Job Cuts (May) (USD, S&P 500, Nasdaq 100, Dow Jones)
- 22:15: EUR ECB Rate Decision, Deposit Facility, Lending Facility, Monetary Policy Statement (Jun) (EUR/USD, EUR/GBP, EUR/JPY, DAX)
- 22:30: USD Jobless Claims, Trade Balance, Productivity, Labor Costs, Imports/Exports (Apr/Q1) (USD, Gold, S&P 500, Nasdaq 100, Dow Jones)
- 22:30: CAD Trade Balance, Exports, Imports (Apr) (USD/CAD, CAD/JPY, TSX)
22:45: EUR ECB Press Conference (EUR/USD, EUR/GBP, EUR/JPY) - Friday, June 6, 2025
All Day: Singapore - Eid al-Adha Public Holiday (USD/SGD) - 00:00: CAD Ivey PMI (May) (USD/CAD, CAD/JPY, TSX)
- 00:15: EUR ECB President Lagarde Speaks (EUR/USD, EUR/GBP, EUR/JPY)
- 02:20: CAD BoC Deputy Gov Kozicki Speaks (USD/CAD, CAD/JPY)
- 03:00: USD Atlanta Fed GDPNow (Q2) (USD, Gold, S&P 500, Nasdaq 100, Dow Jones)
- 03:30: USD Fed Schmid, FOMC Member Harker Speaks (USD, Gold, S&P 500, Nasdaq 100)
View the full economic calendar
View the full economic calendar
-- Written by Matt Simpson
Follow Matt on Twitter @cLeverEdge
How to trade with City Index
You can trade with City Index by following these four easy steps:
- Open an account, or log in if you’re already a customer
• Open an account in the UK
• Open an account in Australia
• Open an account in Singapore
- Search for the market you want to trade in our award-winning platform
- Choose your position and size, and your stop and limit levels
- Place the trade
Related tags:




The complete CFD trading experience
Award-winning platforms, competitive spreads, low commissions and dedicated support.
We live and breathe the markets and are dedicated to helping traders realise their ambitions as we continue to set the industry bar.
Economic calendar
Web Trader platform
Our sophisticated web-based platform is packed with features.
Related articles
USD/CAD shooting star puts September surge on notice
USD/CAD has printed a clear bearish reversal pattern after an extraordinary September surge, but confirmation may depend heavily on how US Treasury yields react to Friday’s payrolls report.

US Dollar Technical Outlook: DXY Bulls Meet Resistance at Yearly Highs 10 1 2026
The U.S. Dollar has held firm despite fading Fed hike bets, but Friday’s payrolls could test the rally’s staying power.


Dow Jones forecast: Stock markets under pressure from multiple sources
When looking at the major tech-heavy US indices like the S&P 500 or the Nasdaq 100, you wouldn’t think that the stock market is particularly weak. Yet, beneath the surface, the market is far from healthy right now. Investors are evidently just piling into the big tech and AI names, and as a result, market breadth is deteriorating. Other indices like the small cap Russell 2000 and the Dow Jones are starting to reflect that weakness.

StoneX Europe Ltd may make third party material available on this website which may contain information included but not limited to the conditions of financial markets. The material is for information purposes only and does not contain, and should not be construed as containing, investment advice and/or investment recommendation and/or an investment research and/or an offer of or solicitation for any transactions in financial instruments; any decision to enter into a specific transaction shall be made by the client following an assessment by him/her of their situation.
StoneX Europe Ltd makes no representation or warranty and assumes no liability as to the accuracy or completeness of the information provided, nor any loss arising from any investment based on a recommendation, forecast or other information supplied. You should always seek independent advice as to your suitability to speculate in any related markets and your ability to assume the associated risks, if you are at all unsure. We are not under any obligation to update any such material. Any opinion made may be personal to the author and may not reflect the opinion of StoneX Europe Ltd.