





Bank of Canada Delivers
The Bank of Canada cut rates today by 50bps from 1.75% to 1.25%
Share this:

Yesterday in our BOC preview, we noted that if the Bank of Canada were to cut rates today it would most likely be on the back of global stimulus due to the coronavirus, and less about the Canadian economy itself. Indeed, the Bank of Canada did cut rates today by 50bps from 1.75% to 1.25% (the lowest level since mid-2018) and noted that it was primarily because the coronavirus would be a negative shock to the economy. The Committee would continue to monitor developments and adjust monetary policy further if necessary.
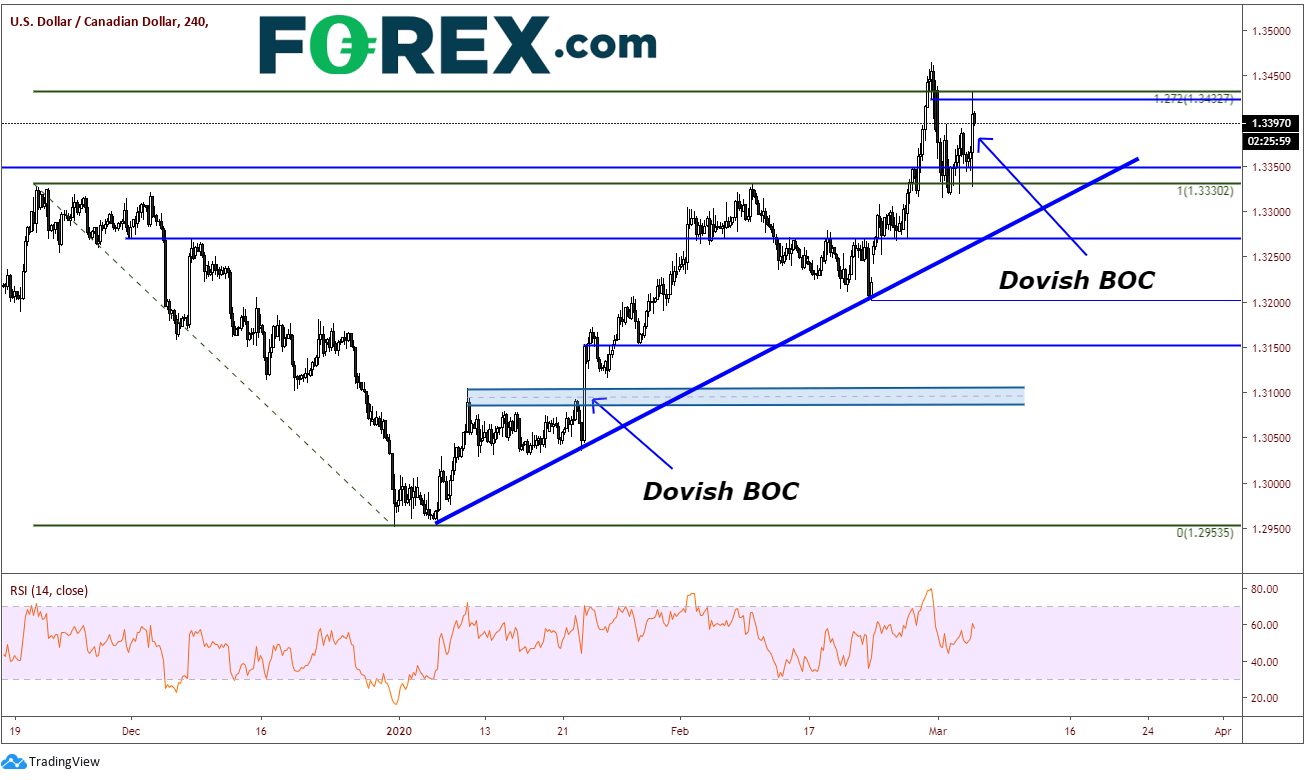
USD/CAD went bid after the announcement, even though price had been moving higher since yesterday in anticipation of a possible rate cut. The headline expectation was for unchanged at 1.75%, however after the US Federal Reserve surprisingly cut rates by 50bps, fx markets began pricing in a BOC cut as well. 50bps was more than markets hoped for and this sent USD/CAD to resistance at the 127.2% Fibonacci extension from the highs from November 20th, 2019 to the lows on December 31st, near 1.3430. Above there, is resistance at Friday’s highs near 1.3465. Horizonal support comes across at 1.3330, and dips to 1.3250 are likely to be bought, as trendline support and horizontal support meet near that level.
Source: Tradingview, City Index
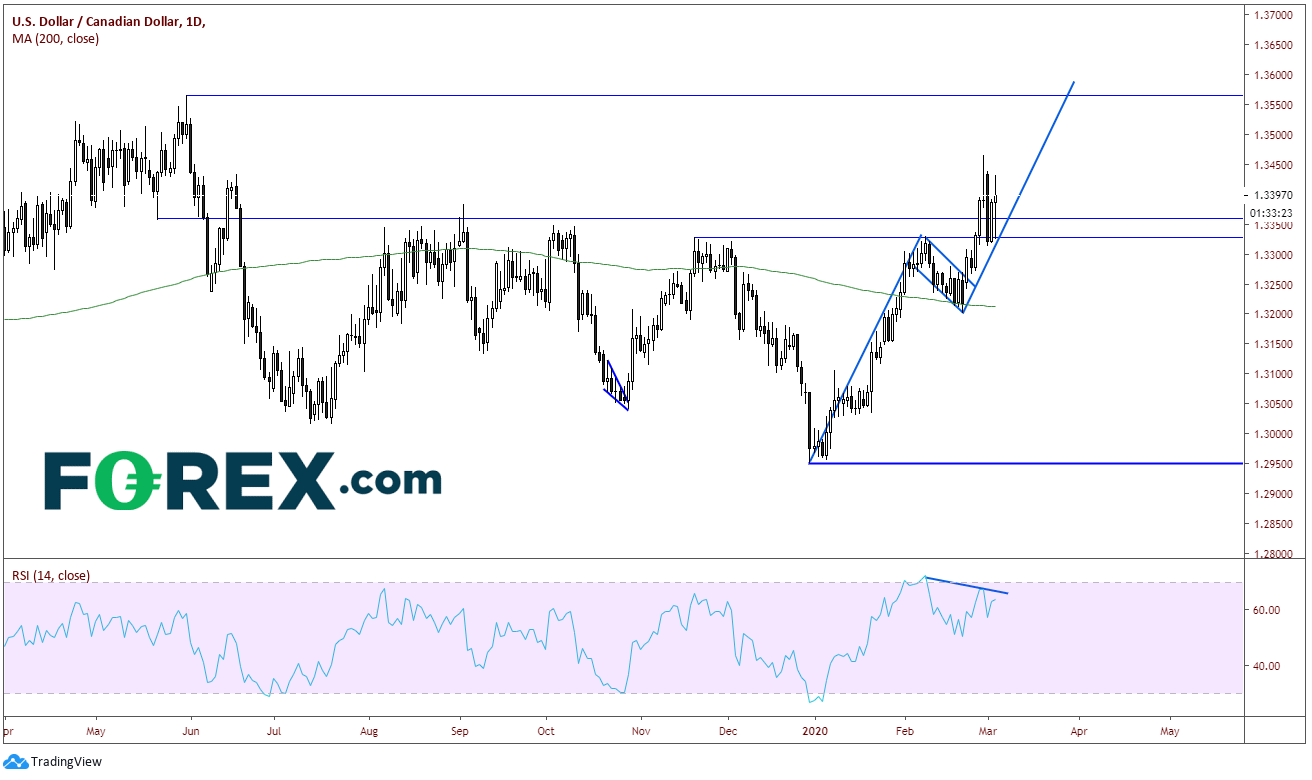
As Canadian rates sit at 1.25%, higher than most of G7 countries (technically, US targets between 1.00%-1.25%), markets may begin to price in another rate cut by the BOC. If such a scenario were to occur, USD/CAD could continue moving higher. On a daily timeframe, it’s easy to see how price has been moving higher off the December 31st lows and pulled back at resistance near 1.3330 to the 200 Day Moving Average as the RSI became overbought, forming a flag formation. On February 21st, price broke out of the flag. The target for a flag the length of the flagpole added to the breakout point of the flag. In this case the target is near 1.3590, just above the horizontal resistance from May 31st, 2019. Of course, nothing moves in a straight line, and a pullback would give the RSI room to unwind as buyers may look to step in and buy the dip.
Source: Tradingview, City Index
Traders now will be waiting and watching as the coronavirus continues to spread across the globe. With rates at 1.25%, Canada still has room to cut. If the virus continues to plague global growth, including Canada, there may be more ahead from the Bank of Canada.
Yesterday in our BOC preview, we noted that if the Bank of Canada were to cut rates today it would most likely be on the back of global stimulus due to the coronavirus, and less about the Canadian economy itself. Indeed, the Bank of Canada did cut rates today by 50bps from 1.75% to 1.25% (the lowest level since mid-2018) and noted that it was primarily because the coronavirus would be a negative shock to the economy. The Committee would continue to monitor developments and adjust monetary policy further if necessary.
USD/CAD went bid after the announcement, even though price had been moving higher since yesterday in anticipation of a possible rate cut. The headline expectation was for unchanged at 1.75%, however after the US Federal Reserve surprisingly cut rates by 50bps, fx markets began pricing in a BOC cut as well. 50bps was more than markets hoped for and this sent USD/CAD to resistance at the 127.2% Fibonacci extension from the highs from November 20th, 2019 to the lows on December 31st, near 1.3430. Above there, is resistance at Friday’s highs near 1.3465. Horizonal support comes across at 1.3330, and dips to 1.3250 are likely to be bought, as trendline support and horizontal support meet near that level.
Source: Tradingview, FOREX.com
As Canadian rates sit at 1.25%, higher than most of G7 countries (technically, US targets between 1.00%-1.25%), markets may begin to price in another rate cut by the BOC. If such a scenario were to occur, USD/CAD could continue moving higher. On a daily timeframe, it’s easy to see how price has been moving higher off the December 31st lows and pulled back at resistance near 1.3330 to the 200 Day Moving Average as the RSI became overbought, forming a flag formation. On February 21st, price broke out of the flag. The target for a flag the length of the flagpole added to the breakout point of the flag. In this case the target is near 1.3590, just above the horizontal resistance from May 31st, 2019. Of course, nothing moves in a straight line, and a pullback would give the RSI room to unwind as buyers may look to step in and buy the dip.
Source: Tradingview, FOREX.com
Traders now will be waiting and watching as the coronavirus continues to spread across the globe. With rates at 1.25%, Canada still has room to cut. If the virus continues to plague global growth, including Canada, there may be more ahead from the Bank of Canada.
Latest market news




The complete CFD trading experience
Award-winning platforms, competitive spreads, low commissions and dedicated support.
We live and breathe the markets and are dedicated to helping traders realise their ambitions as we continue to set the industry bar.
Economic calendar
Web Trader platform
Our sophisticated web-based platform is packed with features.
Related articles
EUR/USD, USD/JPY Outlook: Oil, yields and an FX identity crisis
Crude oil is setting the tone across rates and FX, leaving EUR/USD vulnerable and USD/JPY caught between higher Treasury yields and the growing threat of intervention
AUD/USD Analysis: What's Next for the Australian Dollar After the RBA Decision?
Recent trading sessions have reflected a more neutral tone around the Australian dollar. This can be seen in AUD/USD price action, which has posted moves of roughly 0.2% over the last two sessions without establishing a clear direction. Much of this lack of momentum is linked to expectations surrounding the next policy moves from both the Reserve Bank of Australia (RBA) and the Federal Reserve.

USD into a Massive Week as Yields Fly and Gold Breaks
It’s a huge week with PCE and NFP, but it’s what’s happening off of the calendar that demands attention with US yields flying to fresh multi-decade highs.

StoneX Europe Ltd may make third party material available on this website which may contain information included but not limited to the conditions of financial markets. The material is for information purposes only and does not contain, and should not be construed as containing, investment advice and/or investment recommendation and/or an investment research and/or an offer of or solicitation for any transactions in financial instruments; any decision to enter into a specific transaction shall be made by the client following an assessment by him/her of their situation.
StoneX Europe Ltd makes no representation or warranty and assumes no liability as to the accuracy or completeness of the information provided, nor any loss arising from any investment based on a recommendation, forecast or other information supplied. You should always seek independent advice as to your suitability to speculate in any related markets and your ability to assume the associated risks, if you are at all unsure. We are not under any obligation to update any such material. Any opinion made may be personal to the author and may not reflect the opinion of StoneX Europe Ltd.