





Canadian Dollar Post-BOC Rate Cut: USD/CAD Pushes Tepid Initial Breakout
The 50 bp cut from the Bank of Canada was well priced-in ahead of this morning’s announcement, and several longer-term resistance levels sit overhead around 1.3900, 1.3950 and 1.4000.
Share this:

Canadian Dollar, USD/CAD Talking Points:
- The Bank of Canada cut rates by 50 basis points at this morning’s meeting but given the reaction in USD/CAD that move was already priced-in ahead of time.
- Interestingly as the USD has rallied aggressively against most major currencies over the past few days, USD/CAD is holding the same resistance that was in-play on Monday, explored further below.
The global rate cut bonanza continued this morning with the Bank of Canada’s 50 bp move. This came with little surprise as the initial reaction in the major of USD/CAD was muted, with a grinding move around resistance of 1.3846. Perhaps more interesting is the deduction that USD/CAD had held around that resistance while USD has shown major breaks elsewhere, with EUR/USD and USD/JPY both putting in significant extension of trends in each respective pair.
In the early aftermath of the release, bulls are starting to show a greater push but the big question at this point is whether it’ll be enough to allow a significant breakout to the next resistance level up, around the 1.3900 handle.
USD/CAD Hourly Price Chart
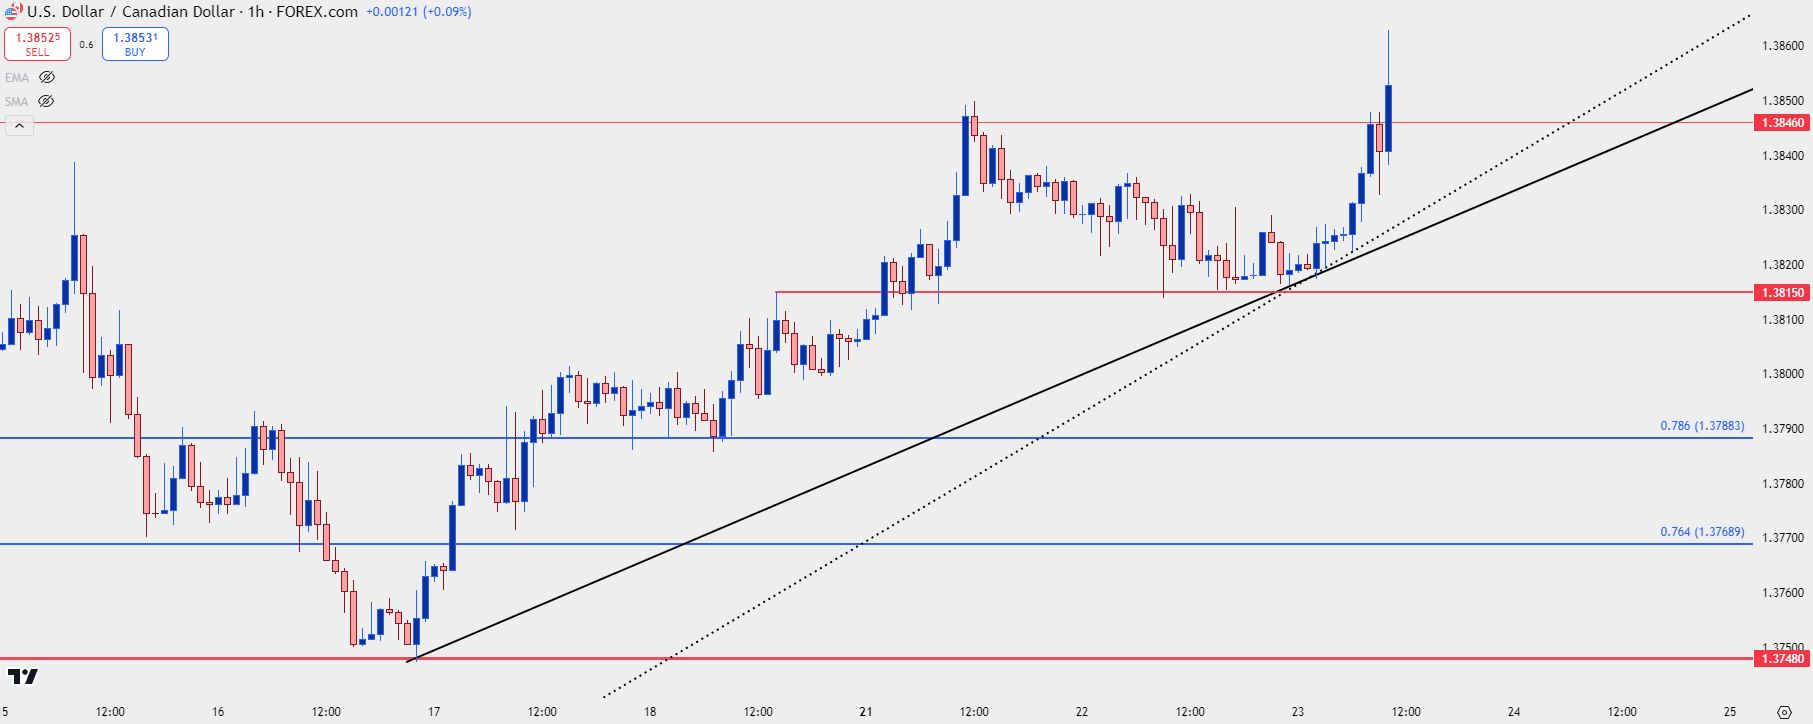 Chart prepared by James Stanley, USD/CAD on Tradingview
USD/CAD The Next 150 Pips Above
Given the natural cross-border trade between the US and Canada, there are a number of shared relationships to consider. There’s of course those that are doing business in both the US and Canada, from which a bit of natural speculation occurs. When the CAD is seen as cheap and the USD expensive, this can impact behavior and the opposite can be true when CAD is perceived as expensive and the USD less so. This is one of the reasons that the pair has built into a range over the past nine years with prices largely holding between 1.2000 and 1.4000 with the notable exception of the pandemic backdrop when the pair spent a couple months above the 1.4000 handle.
USD/CAD Monthly Price Chart
 Chart prepared by James Stanley, USD/CAD on Tradingview
But on a shorter-term basis it’s the 1.4000 level that’s seemed well-defended, with last year’s swing high showing six pipettes below the 1.3900 handle and the swing-high from the year before showing up just inside of 1.3950. This year, when panic was peaking in early-August and VIX spiked to it’s third highest level ever, price put in a temporary but brief break of 1.3900 to hold just below the 1.3950 level.
This isn’t to say that a 1.4000 break is impossible but given the backdrop its notable to consider that some large speculators and producers and businesses can look to take advantage of what’s perceived as a cheap Canadian Dollar should 1.3950 or 1.4000 come into play, and perhaps even to a lesser degree around the 1.3900 level.
This would also seem to solidify the rationale for why the move has stalled around the 1.3850 level that’s being tested right now, even as the USD has shown significant strength against most other major currencies in the past couple days.
USD/CAD Weekly Chart
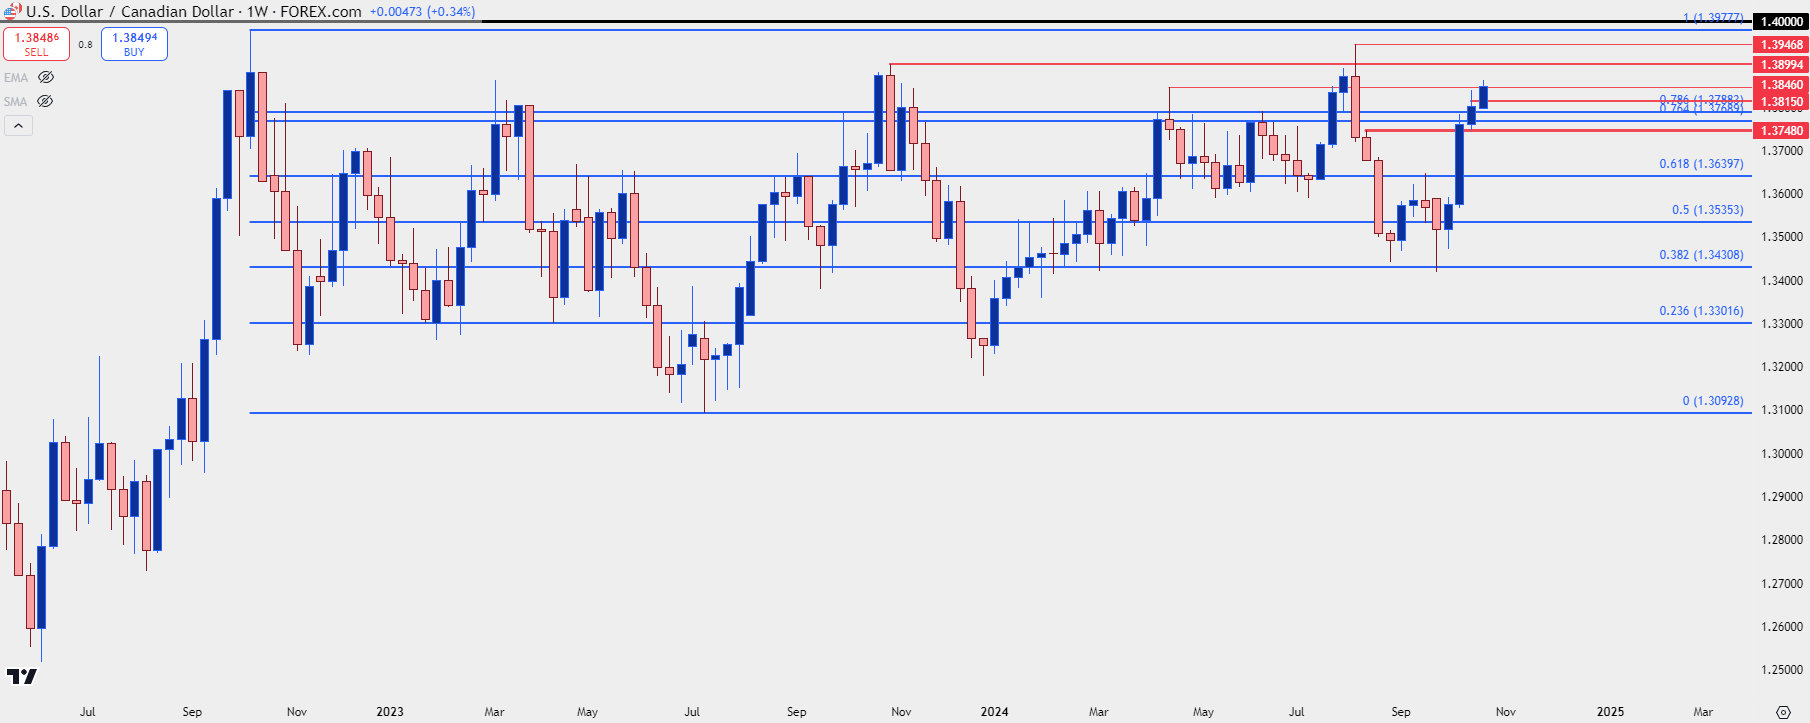 Chart prepared by James Stanley, USD/CAD on Tradingview
USD Near-Term Strategy
Despite the resistance potential that sits overhead, price action is objectively bullish at this point given the continued higher-highs and higher-lows that have printed; so we can’t quite say that it’s bearish from that perspective at this point with a fresh two-month-high showing up this morning.
If we do see a reprieve in the USD, which remains overbought as of this writing, that can begin to change but before sellers look to push bearish trends, they would likely want to wait for a violation of support to substantiate that strategy. The price of 1.3815 seems notable in that regards, as this was the support taken from prior resistance that held the lows ahead of the rate decision. Below that, there are Fibonacci supports at 1.3788 and 1.3769, after which the 1.3748 level comes into the picture and that’s another prior action support that’s confluent with a psychological level (1.3750).
USD/CAD Four-Hour Price Chart
 Chart prepared by James Stanley, USD/CAD on Tradingview
--- written by James Stanley, Senior Strategist
Canadian Dollar, USD/CAD Talking Points:
- The Bank of Canada cut rates by 50 basis points at this morning’s meeting but given the reaction in USD/CAD that move was already priced-in ahead of time.
- Interestingly as the USD has rallied aggressively against most major currencies over the past few days, USD/CAD is holding the same resistance that was in-play on Monday, explored further below.
The global rate cut bonanza continued this morning with the Bank of Canada’s 50 bp move. This came with little surprise as the initial reaction in the major of USD/CAD was muted, with a grinding move around resistance of 1.3846. Perhaps more interesting is the deduction that USD/CAD had held around that resistance while USD has shown major breaks elsewhere, with EUR/USD and USD/JPY both putting in significant extension of trends in each respective pair.
In the early aftermath of the release, bulls are starting to show a greater push but the big question at this point is whether it’ll be enough to allow a significant breakout to the next resistance level up, around the 1.3900 handle.
USD/CAD Hourly Price Chart
USD/CAD The Next 150 Pips Above
Given the natural cross-border trade between the US and Canada, there are a number of shared relationships to consider. There’s of course those that are doing business in both the US and Canada, from which a bit of natural speculation occurs. When the CAD is seen as cheap and the USD expensive, this can impact behavior and the opposite can be true when CAD is perceived as expensive and the USD less so. This is one of the reasons that the pair has built into a range over the past nine years with prices largely holding between 1.2000 and 1.4000 with the notable exception of the pandemic backdrop when the pair spent a couple months above the 1.4000 handle.
USD/CAD Monthly Price Chart
But on a shorter-term basis it’s the 1.4000 level that’s seemed well-defended, with last year’s swing high showing six pipettes below the 1.3900 handle and the swing-high from the year before showing up just inside of 1.3950. This year, when panic was peaking in early-August and VIX spiked to it’s third highest level ever, price put in a temporary but brief break of 1.3900 to hold just below the 1.3950 level.
This isn’t to say that a 1.4000 break is impossible but given the backdrop its notable to consider that some large speculators and producers and businesses can look to take advantage of what’s perceived as a cheap Canadian Dollar should 1.3950 or 1.4000 come into play, and perhaps even to a lesser degree around the 1.3900 level.
This would also seem to solidify the rationale for why the move has stalled around the 1.3850 level that’s being tested right now, even as the USD has shown significant strength against most other major currencies in the past couple days.
USD/CAD Weekly Chart
USD Near-Term Strategy
Despite the resistance potential that sits overhead, price action is objectively bullish at this point given the continued higher-highs and higher-lows that have printed; so we can’t quite say that it’s bearish from that perspective at this point with a fresh two-month-high showing up this morning.
If we do see a reprieve in the USD, which remains overbought as of this writing, that can begin to change but before sellers look to push bearish trends, they would likely want to wait for a violation of support to substantiate that strategy. The price of 1.3815 seems notable in that regards, as this was the support taken from prior resistance that held the lows ahead of the rate decision. Below that, there are Fibonacci supports at 1.3788 and 1.3769, after which the 1.3748 level comes into the picture and that’s another prior action support that’s confluent with a psychological level (1.3750).
USD/CAD Four-Hour Price Chart
--- written by James Stanley, Senior Strategist
Related tags:
Latest market news




The complete CFD trading experience
Award-winning platforms, competitive spreads, low commissions and dedicated support.
We live and breathe the markets and are dedicated to helping traders realise their ambitions as we continue to set the industry bar.
Economic calendar
Web Trader platform
Our sophisticated web-based platform is packed with features.
Related articles
EUR/USD weekly outlook: FOMC and ECB to set the tone
The current backdrop is modestly bearish. On Friday, the EUR/USD closed modestly lower, down for the third consecutive day. The pair also posted a weekly decline after staging a modest recovery attempt in the previous week. Out of the past 8 weeks, the EUR/USD has fallen on 6 occasions. There is not much supporting factors for the single currency right now. So, the upside remains capped.

Gold Does Something it Hasn’t Done in a Year, is Larger Risk-Off Afoot?
With tech stocks getting hit harder last week there was collateral damage elsewhere, including gold as the metal closed below the $4k level for the week and that’s the first time that’s happened to spot gold in more than a year.

US Dollar Price Action Setups: EUR/USD, USD/JPY, GBP/USD, USD/CAD
The Dollar is working on its second consecutive red week and while sellers didn’t exactly pounce on fresh lows, there’s an opening door for bears to make a move.
StoneX Europe Ltd may make third party material available on this website which may contain information included but not limited to the conditions of financial markets. The material is for information purposes only and does not contain, and should not be construed as containing, investment advice and/or investment recommendation and/or an investment research and/or an offer of or solicitation for any transactions in financial instruments; any decision to enter into a specific transaction shall be made by the client following an assessment by him/her of their situation.
StoneX Europe Ltd makes no representation or warranty and assumes no liability as to the accuracy or completeness of the information provided, nor any loss arising from any investment based on a recommendation, forecast or other information supplied. You should always seek independent advice as to your suitability to speculate in any related markets and your ability to assume the associated risks, if you are at all unsure. We are not under any obligation to update any such material. Any opinion made may be personal to the author and may not reflect the opinion of StoneX Europe Ltd.