





Canadian Dollar Forecast: USD/CAD Builds Bull Pennant into Tariffs
USD/CAD has seen price action tighten over the past six weeks, even as the tariff topic has kept volatility flowing through several headlines.
Share this:

Canadian Dollar, USD/CAD Talking Points:
- USD/CAD showed another higher-low this week, further digesting into a symmetrical triangle ahead of the widely anticipated April 2 tariff date.
- There’s quite a bit of unknown around the matter and potential for ‘new’ drive brings along with it potential for volatility in markets. Mark Carney has announced snap elections for April 28th and that invites another variable into the mix.
- From a price action perspective, it’s the same story that’s been in-play for the past month with both higher-lows and lower-highs. This sets the table for a possible breakout when one side finally gets enough motivation to support momentum following a break. The question now is ‘when?’
USD/CAD is continuing to digest following the massive start to 2025 trade. At this point it can be qualified as a bull pennant formation, as we have a symmetrical triangle taking place atop a bullish trend. Those can be tricky formations though, especially on a longer-term basis; but it can help to assign some element of directional bias to an otherwise directionless formation such as the symmetrical triangle.
USD/CAD Daily Chart
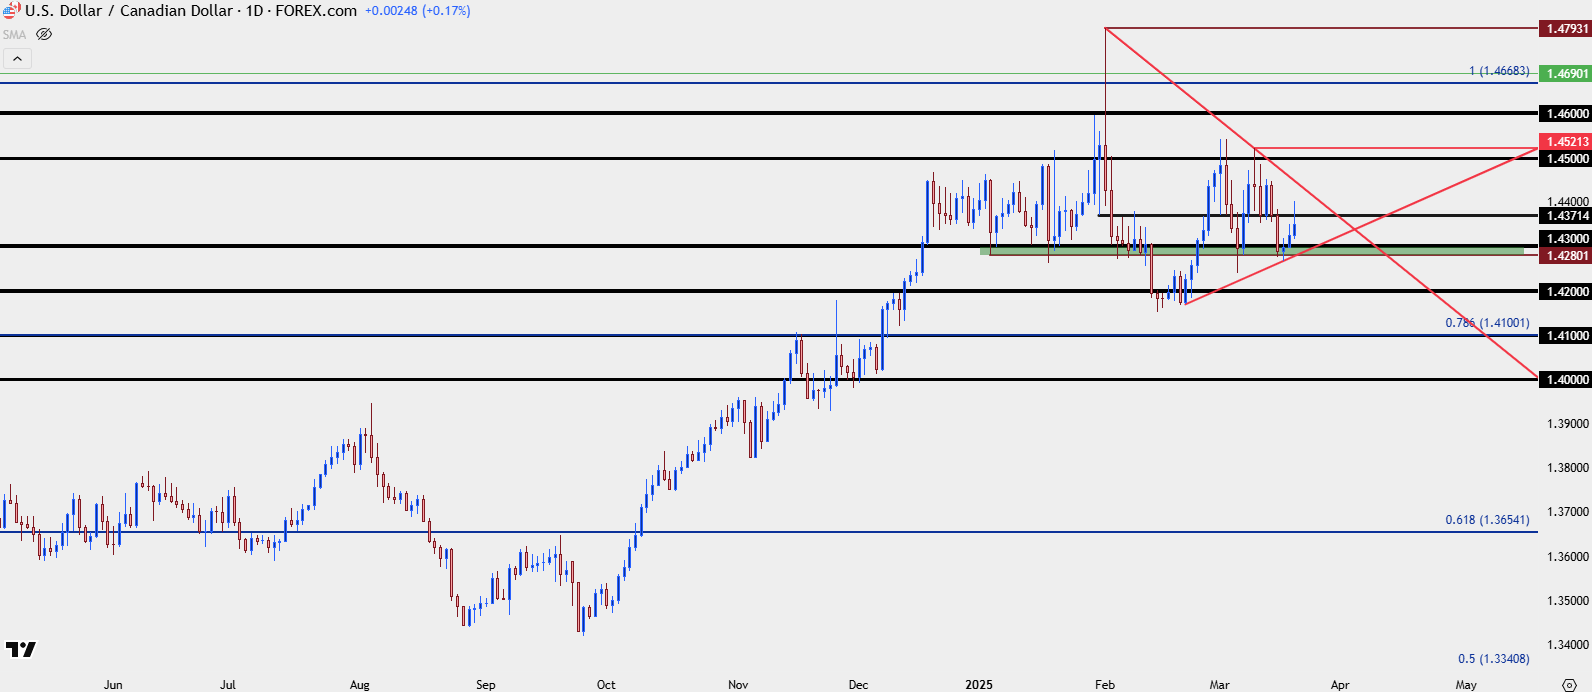 Chart prepared by James Stanley; data derived from Tradingview
There’s a lot going on around both Canada and the U.S. at the moment and there’s perhaps even more to be seen on April 2nd, when tariffs are, again, set to come into place on Canada from the United States. So far, this drama has produced several twists and turns with tariffs getting delayed or pushed back each time. But Canada looks to toe the line with retaliation so this could turn into a fight between the two economies.
There is still a lot of unknown though, such as what products will be tariffed and by how much; not to mention the actual execution of tariffs and how they will be implemented. There’s also been another recent change in the Canadian landscape as Mark Carney has taken over for Justin Trudeau, and he’s announced snap elections for April 28th. This topic remains a hot button in Canada, so I fully expect this to have sway over election results, to some degree.
This makes forecasting fundamentals considerably more difficult given just how much is unknown about how all of this will play out. And that’s perhaps why price action is so important here, because we can get a near real-time gauge on how markets are treating this driver. In USD/CAD right now, that would appear to be a relaxation of the panic that had hit earlier in the year, as the pair spiked to a fresh 20-plus year high.
I think the takeaway is that given the multiple delays and false starts on tariffs, combined with the pain in U.S. equity markets on the back of tariffs, there’s a under-the-surface desire to strike some sort of trade deal. With Trump continuing the conjecture around Canada as a 51st state, it seems as though he’s ‘over-asking’ in order to negotiate some sort of truce in which Canada and the U.S. strike a sort of preferential trade relationship. The idea of statehood for Canada has been widely rejected and it seems unlikely unless something significant had changed, but Trump starting negotiations by asking for more than he knows would be possible is not an unknown tactic, as he discussed this in his book The Art of the Deal. This way, both sides can compromise and walk away feeling as though they gained.
This would help to explain the lower-highs that have held in USD/CAD since that initial flare in February, with the 1.4500 level coming in more recently to cap the advance in the pair.
USD/CAD Four-Hour Chart
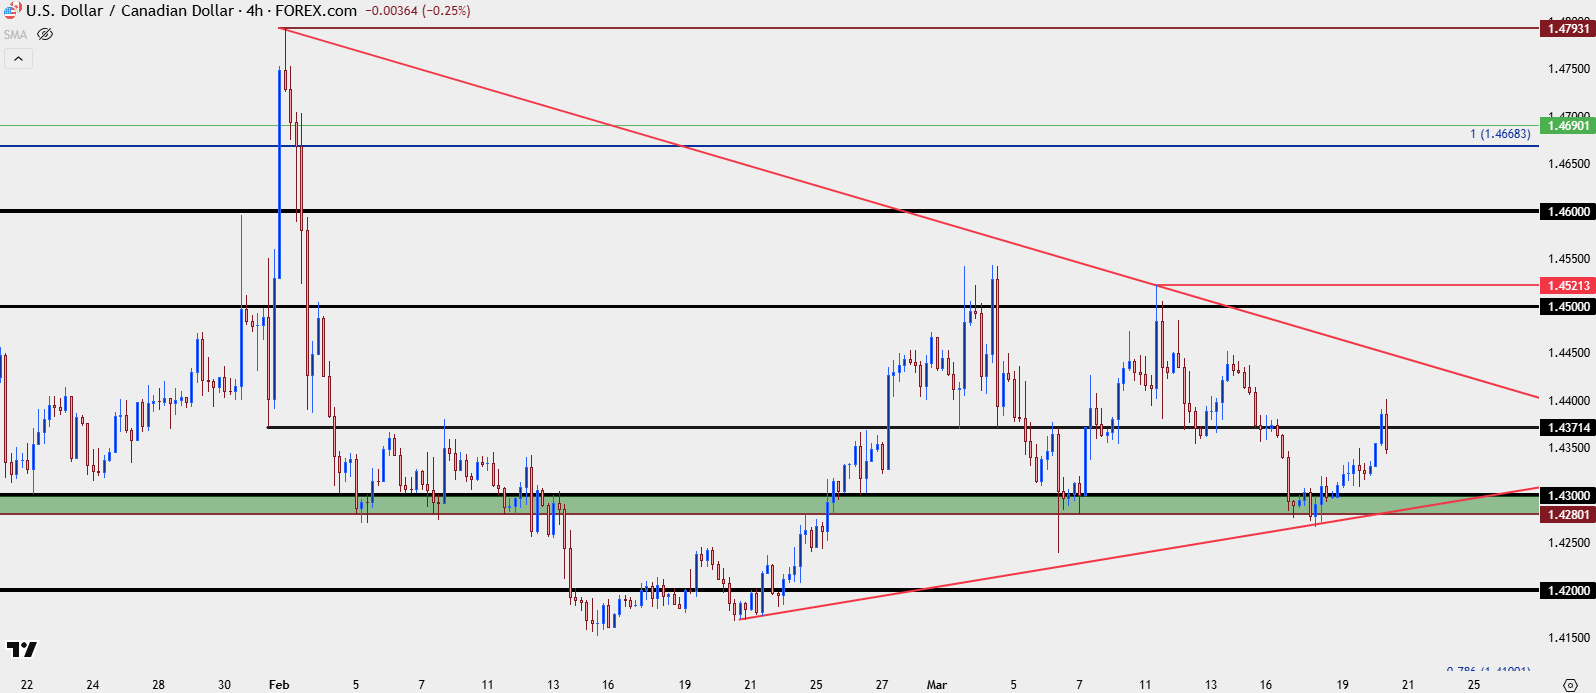 Chart prepared by James Stanley; data derived from Tradingview
USD/CAD Skipping to the End of the Story
My expectation is that USD/CAD will end up continuing the longer-term range that’s been in-play for the past nine years, and that’s been the case since November when this topic first started to take over the headlines. How we get there, however, can be a winding road and that doesn’t necessarily mean that a high is in-place; whether it is or not will likely revolve around just how far Trump wants to push the risk and that’s an unknown variable that must be respected at this point.
With that said, the 1.4500 level remains of interest for resistance, and if there’s another upper wick on a daily bar, particularly if that holds inside of the prior swing high of 1.4521, the door would be open for a downside swing. If bulls do force a larger break, there’s follow-through resistance potential at 1.4600, and then the longer-term swing highs of 1.4669-1.4690.
On the downside, caution should be exercised here as profit taking from the longer-term breakout has produced a couple of bear traps already; but the same 1.4280-1.4300 zone has so far held the higher-low, and a breach of that, particularly with a closed body on the daily, indicates potential for bearish continuation, which would then highlight 1.4200.
Bigger picture, it’s the 1.4000 level that can help to highlight return of the longer-term range, whenever bears do make a lasting push below that.
USD/CAD Daily Chart
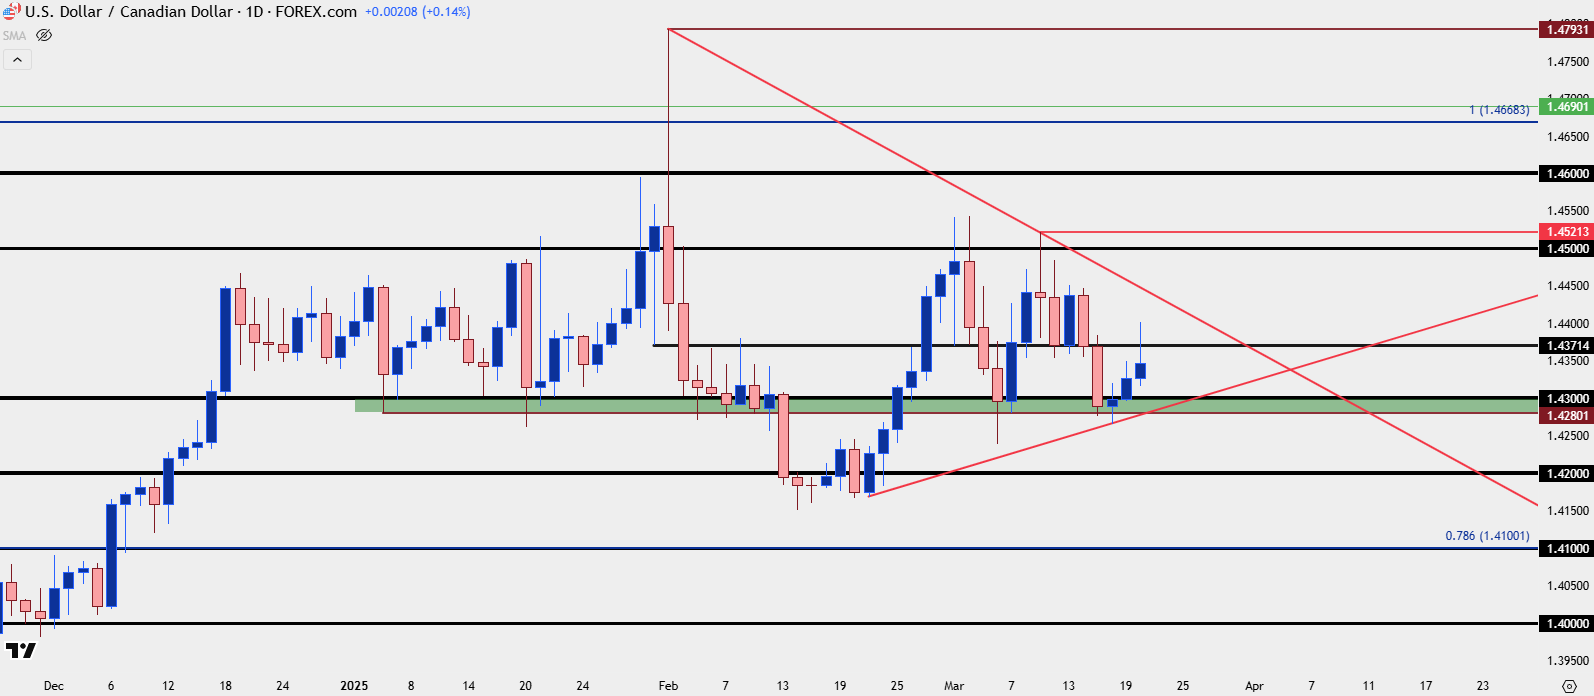 Chart prepared by James Stanley; data derived from Tradingview
--- written by James Stanley, Senior Strategist
Canadian Dollar, USD/CAD Talking Points:
- USD/CAD showed another higher-low this week, further digesting into a symmetrical triangle ahead of the widely anticipated April 2 tariff date.
- There’s quite a bit of unknown around the matter and potential for ‘new’ drive brings along with it potential for volatility in markets. Mark Carney has announced snap elections for April 28th and that invites another variable into the mix.
- From a price action perspective, it’s the same story that’s been in-play for the past month with both higher-lows and lower-highs. This sets the table for a possible breakout when one side finally gets enough motivation to support momentum following a break. The question now is ‘when?’
USD/CAD is continuing to digest following the massive start to 2025 trade. At this point it can be qualified as a bull pennant formation, as we have a symmetrical triangle taking place atop a bullish trend. Those can be tricky formations though, especially on a longer-term basis; but it can help to assign some element of directional bias to an otherwise directionless formation such as the symmetrical triangle.
USD/CAD Daily Chart
Chart prepared by James Stanley; data derived from Tradingview
There’s a lot going on around both Canada and the U.S. at the moment and there’s perhaps even more to be seen on April 2nd, when tariffs are, again, set to come into place on Canada from the United States. So far, this drama has produced several twists and turns with tariffs getting delayed or pushed back each time. But Canada looks to toe the line with retaliation so this could turn into a fight between the two economies.
There is still a lot of unknown though, such as what products will be tariffed and by how much; not to mention the actual execution of tariffs and how they will be implemented. There’s also been another recent change in the Canadian landscape as Mark Carney has taken over for Justin Trudeau, and he’s announced snap elections for April 28th. This topic remains a hot button in Canada, so I fully expect this to have sway over election results, to some degree.
This makes forecasting fundamentals considerably more difficult given just how much is unknown about how all of this will play out. And that’s perhaps why price action is so important here, because we can get a near real-time gauge on how markets are treating this driver. In USD/CAD right now, that would appear to be a relaxation of the panic that had hit earlier in the year, as the pair spiked to a fresh 20-plus year high.
I think the takeaway is that given the multiple delays and false starts on tariffs, combined with the pain in U.S. equity markets on the back of tariffs, there’s a under-the-surface desire to strike some sort of trade deal. With Trump continuing the conjecture around Canada as a 51st state, it seems as though he’s ‘over-asking’ in order to negotiate some sort of truce in which Canada and the U.S. strike a sort of preferential trade relationship. The idea of statehood for Canada has been widely rejected and it seems unlikely unless something significant had changed, but Trump starting negotiations by asking for more than he knows would be possible is not an unknown tactic, as he discussed this in his book The Art of the Deal. This way, both sides can compromise and walk away feeling as though they gained.
This would help to explain the lower-highs that have held in USD/CAD since that initial flare in February, with the 1.4500 level coming in more recently to cap the advance in the pair.
USD/CAD Four-Hour Chart
Chart prepared by James Stanley; data derived from Tradingview
USD/CAD Skipping to the End of the Story
My expectation is that USD/CAD will end up continuing the longer-term range that’s been in-play for the past nine years, and that’s been the case since November when this topic first started to take over the headlines. How we get there, however, can be a winding road and that doesn’t necessarily mean that a high is in-place; whether it is or not will likely revolve around just how far Trump wants to push the risk and that’s an unknown variable that must be respected at this point.
With that said, the 1.4500 level remains of interest for resistance, and if there’s another upper wick on a daily bar, particularly if that holds inside of the prior swing high of 1.4521, the door would be open for a downside swing. If bulls do force a larger break, there’s follow-through resistance potential at 1.4600, and then the longer-term swing highs of 1.4669-1.4690.
On the downside, caution should be exercised here as profit taking from the longer-term breakout has produced a couple of bear traps already; but the same 1.4280-1.4300 zone has so far held the higher-low, and a breach of that, particularly with a closed body on the daily, indicates potential for bearish continuation, which would then highlight 1.4200.
Bigger picture, it’s the 1.4000 level that can help to highlight return of the longer-term range, whenever bears do make a lasting push below that.
USD/CAD Daily Chart
Chart prepared by James Stanley; data derived from Tradingview
--- written by James Stanley, Senior Strategist
Latest market news



The complete CFD trading experience
Award-winning platforms, competitive spreads, low commissions and dedicated support.
We live and breathe the markets and are dedicated to helping traders realise their ambitions as we continue to set the industry bar.
Economic calendar
Web Trader platform
Our sophisticated web-based platform is packed with features.
Related articles
EUR/USD weekly outlook: Oil, inflation and NFP in focus
After coming under significant pressure in recent weeks, the EUR/USD came off its lows to finish the week on a positive note on Friday, albeit with only a mild rebound. That was not enough to prevent the exchange rate falling for the third consecutive week, as the US dollar and bond yields rallied across the board.
Gold Price Forecast: XAU/USD Avoids Breakdown as Yields Surged but Can it Continue?
Surging Treasury yields sent a jolt across markets last week but, so far, gold prices have held above the FOMC low. The big question now is whether that can continue and, if not, will bulls show up at $4100 or $4k like they did in June and July?
Gold Q4 2026 outlook: Resilience in the face of rallying dollar and yields
As we headed towards the latter stages of Q3 and into Q4, the Fed had just hiked rates in a hawkish FOMC meeting, while the likes of the ECB and BoJ had also tightened their respective policies. Oil prices remained elevated amid the prolonged US-Iran conflict. Meanwhile, bond yields were breaking out, and the dollar was higher across the board. Yet, remarkably, gold was still holding in the positive territory for the third quarter, even if it had weakened somewhat in September.
StoneX Europe Ltd may make third party material available on this website which may contain information included but not limited to the conditions of financial markets. The material is for information purposes only and does not contain, and should not be construed as containing, investment advice and/or investment recommendation and/or an investment research and/or an offer of or solicitation for any transactions in financial instruments; any decision to enter into a specific transaction shall be made by the client following an assessment by him/her of their situation.
StoneX Europe Ltd makes no representation or warranty and assumes no liability as to the accuracy or completeness of the information provided, nor any loss arising from any investment based on a recommendation, forecast or other information supplied. You should always seek independent advice as to your suitability to speculate in any related markets and your ability to assume the associated risks, if you are at all unsure. We are not under any obligation to update any such material. Any opinion made may be personal to the author and may not reflect the opinion of StoneX Europe Ltd.