



China A50 and USD/CNH in focus for tomorrow’s CPI data
It is a big week for inflation enthusiasts, with CPI data for December released from China and the US.
Share this:

China release CPI data for December tomorrow, and the general consensus is for inflation to have softened at the end of the year due to lower food prices. NBS (National Bureau of Statistics) headline CPI is currently forecast to rise just 1.6% y/y, down from 2.3% previously.
However, if recent trends are to persist, such as transportation/communication and education/culture and recreation rising notably then we could be in for an upside surprise from Beijing. And if we are to see an upside surprise it could further excite US dollar bulls who anticipate higher inflation in the US this week, which is basically a proxy for a more hawkish Fed and, ultimately, a bullish dollar.
Read our guide on Forex interest rate trading
Read our guide on Forex interest rate trading
If we do see a resurgence of the US dollar we are interested to see if it can gain notable ground against the offshore yuan (USD/CNH). It has not been the easiest of markets to trade since mid-October, looking at its sideways range and overlapping daily candles. But what has piqued our interest is the two false breaks of 6.3500 support.


On December the 8th, USD/CNH closed below 6.35 yet promptly reversed losses the following day to mark a bear-trap. A second attempt to break 6.35 arrived on December 31st which saw a ‘buying tail’ and daily close above the key level. Now prices have drifted higher we remain bullish above 3.65 and seeking a move to 6.42. Bulls could wait for a break above trend resistance / recent highs to put the bullish bias into action. Until then there are risks for another dip lower.
China A50 builds another base above 15,200
The China A50 has steadily moved lower since reaching our original 16,436 target. In December we had noted the reversal candles which failed to close above that key level which ultimately marked the beginning of its correction. Whilst it failed to hold above 16,000 as we’d hoped, the index does appear to have found support above 15,200, in line with a series of previous lows and a hammer which closed above that level to denote demand above 15,200.

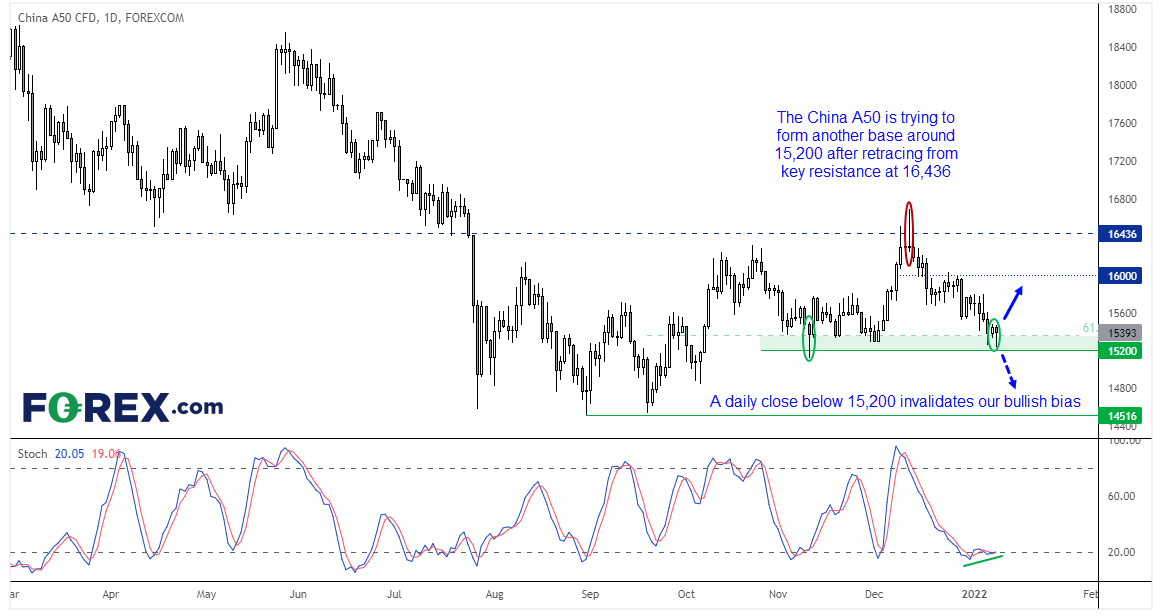
Furthermore, the stochastic oscillator recently moved into oversold territory and based around 15.5 (in line with previous stochastic troughs) and a small bullish divergence has since formed. A small bullish inside candle and bullish hammer have also formed over the past two session around support, so we now anticipate a rally from current levels. A daily close below 15,200 invalidates our near-term bullish bias.
How to trade with City Index
You can trade easily trade with City Index by using these four easy steps:
- Open an account, or log in if you’re already a customer
• Open an account in the UK
• Open an account in Australia
• Open an account in Singapore
- Search for the company you want to trade in our award-winning platform
- Choose your position and size, and your stop and limit levels
- Place the trade
How to trade with FOREX.com
Follow easy steps to start trading with FOREX.com today:
- Open a Forex.com account, or log in if you’re already a customer.
- Search for the pair you want to trade in our award-winning platform.
- Choose your position and size, and your stop and limit levels.
- Place the trade.
Latest market news




The complete CFD trading experience
Award-winning platforms, competitive spreads, low commissions and dedicated support.
We live and breathe the markets and are dedicated to helping traders realise their ambitions as we continue to set the industry bar.
Economic calendar
Web Trader platform
Our sophisticated web-based platform is packed with features.
Related articles
Silver's bullish breakout case builds as bond yields retreat
The Democratic blue wave has sent crude and Treasury yields sharply lower, improving the outlook for precious metals. With gold already breaking higher, could silver be next?
Swiss Franc Short-term Outlook: USD/CHF Selloff Nears Critical Support Ahead of NFP 11 4 2026
USD/CHF bears are closing in on critical trend support, with the next reaction likely to determine whether the October decline has further to run.

US Midterm Fallout: What Does the “Blue Tsunami” Mean for the S&P 500?
Democrats made sweeping gains in the US midterm elections, winning control of both the House and Senate - what does it mean for the S&P 500 and the AI trade?

StoneX Europe Ltd may make third party material available on this website which may contain information included but not limited to the conditions of financial markets. The material is for information purposes only and does not contain, and should not be construed as containing, investment advice and/or investment recommendation and/or an investment research and/or an offer of or solicitation for any transactions in financial instruments; any decision to enter into a specific transaction shall be made by the client following an assessment by him/her of their situation.
StoneX Europe Ltd makes no representation or warranty and assumes no liability as to the accuracy or completeness of the information provided, nor any loss arising from any investment based on a recommendation, forecast or other information supplied. You should always seek independent advice as to your suitability to speculate in any related markets and your ability to assume the associated risks, if you are at all unsure. We are not under any obligation to update any such material. Any opinion made may be personal to the author and may not reflect the opinion of StoneX Europe Ltd.