



Crude oil forecast: Technical Tuesday | November 11, 2025
Crude oil forecast: After months of falling oil prices, can we now see a recovery in Brent and WTI? That’s what it looks like as we take a delve into the charts of the oil contracts in this edition of Technical Tuesday.
Share this:

Crude oil forecast: After months of falling oil prices, can we now see a recovery in Brent and WTI? That’s what it looks like as we take a delve into the charts of the oil contracts in this edition of Technical Tuesday.
But before do that, let’s talk about the macro picture first…
Analysis: What’s driving oil prices?
Crude oil prices have been steadier so far this week after falling for two consecutive weeks and down in the last three months. Sentiment towards oil has been quite bearish thanks to expectations that crude oil supply will exceed demand growth in the months ahead. This is largely due to higher OPEC+ production and record US output. But countering this, we have seen China fill up its strategic reserves significantly, taking advantage of weaker oil prices and absorbing at least some of the excess supply. Meanwhile, the economic fallout from Trump’s trade war hasn’t been too significant either to hurt demand as much as had been feared, while the lower oil prices have discouraged US producers to drill as much as one would have expected when Trump declared “drill baby drill” when he took office earlier this year. As a result, oil prices have turned somewhat neutral. But can the crude oil forecast turn positive now?
Can crude oil prices make a comeback?
Expectations that crude oil supply will exceed demand growth in the months ahead – owing to OPEC+ production hikes and record US crude output – have weighed on prices in recent months. A bearish trend has emerged ever since prices peaked in June, but the question now is whether that trend is starting to turn positive.
Looking at the daily chart of WTI, price action has not been entirely bearish in recent weeks. There are tentative signs that a recovery in oil prices could be on the horizon, but more confirmation is needed before turning decisively bullish. WTI has been consolidating inside what appears to be a bull flag pattern over the past several days. It rallied from a strong support zone between $55 and $56, touching the top of that range around October 20 before losing momentum and entering consolidation. Now, it appears that WTI is poking its head above the resistance trend of this bull flag pattern.

The key will be whether WTI crude oil price can post a decisive close outside of this pattern and hold above the crucial $60 level — a level that has been tested several times recently. Initially, it acted as support before prices broke below it, but the lack of follow-through to the downside suggests that sellers have taken profit, leading prices to climb back above $60. This makes the current setup quite interesting. There’s a possibility that the market is turning bullish, though confirmation will depend on further price action. As long as the series of lower lows and lower highs remain intact, traders will have to assess the situation level by level.
Key levels to watch on WTI
From here, the next potential resistance lies around $62 — a level that offered strong support in August and September before being broken. This makes it the first and immediate target for the bulls. Beyond that lies a major technical zone between $63.60 and $64.95, where the 200-day moving average and previous lows from 2023 and 2024 converge. This zone could act as a longer-term resistance area, and prices might resume their decline if they reach it. However, if oil manages to break above that region, it could signal a much stronger bullish reversal. For now, the focus remains on whether WTI can maintain strength above $60 and break out of its consolidation range.
Brent crude oil forecast: UK oil bull flagging
Brent crude is showing a similar setup. Like WTI, it’s trying to break out of a bull flag pattern after showing signs of recovery in recent days. The key test for Brent lies in whether it can climb out of this formation and push through resistance between $65 and $66 – an area that previously served as both support and resistance. A decisive break and hold above this region would strengthen the bullish case for Brent, supporting the crude oil forecast.
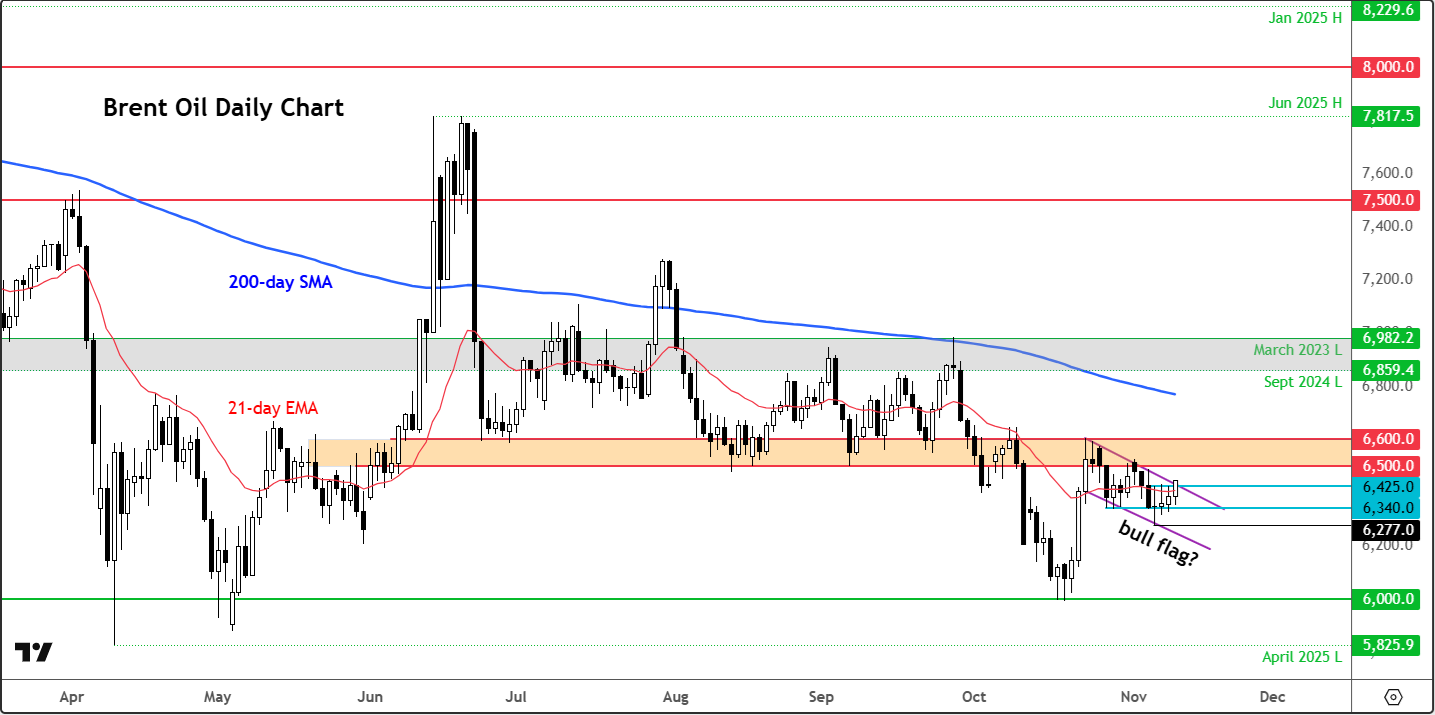
On the downside, $64.25 marks the highs of recent sessions and serves as an important short-term level to monitor. Below that, $63.40 and last week’s low of $62.77 provide additional support levels, with the latter acting as the short-term line in the sand. Interestingly, the $60 mark — a psychologically important level — has so far held firm after being tested in mid-October. Prices bounced sharply from that zone before meeting resistance again around $65–$66, where sellers re-emerged.
The recent consolidation into a potential bull flag pattern suggests that oil prices may be gearing up for an upside breakout. Whether this leads to a sustainable recovery will depend on the follow-through above key resistance zones and confirmation from price action in the days ahead.
Source for all charts used in this article: TradingView.com
-- Written by Fawad Razaqzada, Market Analyst
Follow Fawad on Twitter @Trader_F_R
Related tags:
Latest market news




The complete CFD trading experience
Award-winning platforms, competitive spreads, low commissions and dedicated support.
We live and breathe the markets and are dedicated to helping traders realise their ambitions as we continue to set the industry bar.
Economic calendar
Web Trader platform
Our sophisticated web-based platform is packed with features.
Related articles
S&P 500, Nasdaq, Dow Forecast: Wall Street Split Widens Into Month-End 9 26 2026
Nasdaq strength contrasts with mounting Dow pressure as rising Treasury yields raise the stakes for stocks heading into the monthly close.


EUR/USD Q4 2026 Outlook: Euro at a Crossroads as Fed, ECB Tighten 9 25 2026
EUR/USD enters Q4 at a pivotal inflection point as competing Fed-ECB policy paths and persistent inflation risks collide with major technical support.

S&P 500 Forecast: SPX rises as oil prices fall, but treasuries remain at multi-decade highs
U.S. stocks are rising on Friday after a volatile week that saw a surge in Treasury yields ripple through financial markets.

StoneX Europe Ltd may make third party material available on this website which may contain information included but not limited to the conditions of financial markets. The material is for information purposes only and does not contain, and should not be construed as containing, investment advice and/or investment recommendation and/or an investment research and/or an offer of or solicitation for any transactions in financial instruments; any decision to enter into a specific transaction shall be made by the client following an assessment by him/her of their situation.
StoneX Europe Ltd makes no representation or warranty and assumes no liability as to the accuracy or completeness of the information provided, nor any loss arising from any investment based on a recommendation, forecast or other information supplied. You should always seek independent advice as to your suitability to speculate in any related markets and your ability to assume the associated risks, if you are at all unsure. We are not under any obligation to update any such material. Any opinion made may be personal to the author and may not reflect the opinion of StoneX Europe Ltd.