


Crude Oil Weekly Outlook: Brent Tests September Highs, WTI Tops $100, and XLE Reclaims 18-Year Resistance
Crude Oil Weekly Outlook: Brent is testing its September highs, WTI has moved towards $100, and XLE has reclaimed its 18 year resistance. Explore the key levels that could define the next move in oil.
Share this:

Brent crude is testing its September highs, WTI has moved back towards the psychological 100 level, and the energy sector ETF (XLE) has reclaimed its 18 year resistance zone. These moves have brought upside momentum back into focus in line with escalating geopolitical tensions. At the same time, daily momentum across WTI, Brent and XLE is approaching overbought territory, raising the risk of a pullback as we approach Israel's national elections on October 27 and US mid term elections on November 3.
The market is balancing immediate supply concerns against a weaker demand outlook. The IEA has lowered its 2026 oil-demand forecast, citing high prices, restricted supply and a deteriorating economic outlook. Meanwhile, US commercial crude inventories fell by 8.6 million barrels in the week ended October 9, leaving stocks about 3% below their five-year average.
Geopolitical risks remain elevated. Attacks on shipping in and around the Strait of Hormuz have intensified, while Ukraine’s latest drone strikes hit oil facilities in Russia. The IEA has also accelerated the release of emergency oil stocks, but supply concerns have continued to support prices.
With major elections around the corner, political considerations may complicate negotiations. A tougher negotiating stance could raise the risk of short-term escalation, even if the longer-term aim remains a settlement.
The focus now is whether momentum can sustain the latest advance or whether overbought conditions will trigger a pullback. The levels below frame the potential for a further surge beyond this year’s highs against the risk of a broader corrective cycle.
Brent Crude Oil: Three-Day Time Frame – Log Scale
Source: TradingView
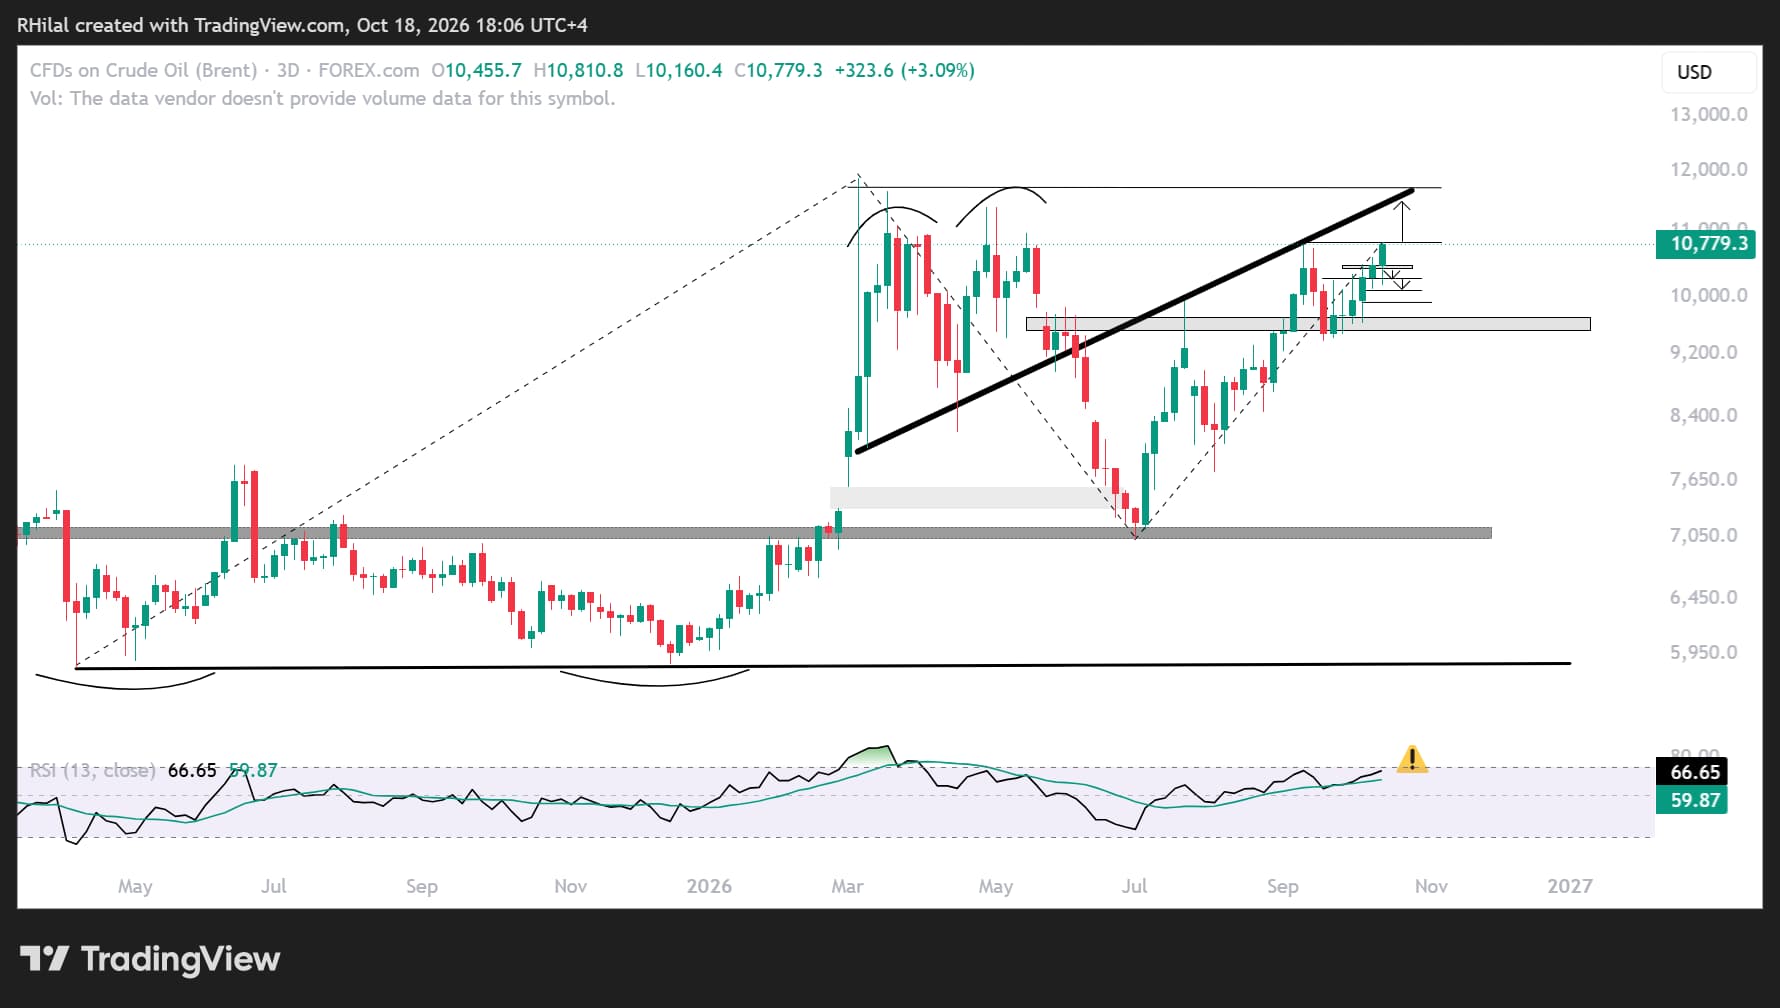
Brent is leading WTI and has moved towards the September high near 108, a level that also marks the 61.8% Fibonacci extension of the April 2025–March 2026–July 2026 cycle. The three-day RSI is approaching overbought levels last seen in September and March, increasing the risk of a pause or pullback even as price momentum remains strong.
Bullish scenario: A sustained breakout above 108 would keep the advance in focus and bring the multi-month support-turned-resistance zone near 117 into view. That area could present another pullback risk and raise the possibility of a double-top pattern near this year’s highs.
Bearish scenario: A break below 104 and then 100 would increase the risk of a bearish reversal, with 94 as the next level to watch. A sustained move lower would strengthen the case for a broader year-end drawdown, particularly if geopolitical tensions ease and supply concerns recede.
WTI Crude Oil: Daily Time Frame – Log Scale
Source: TradingView
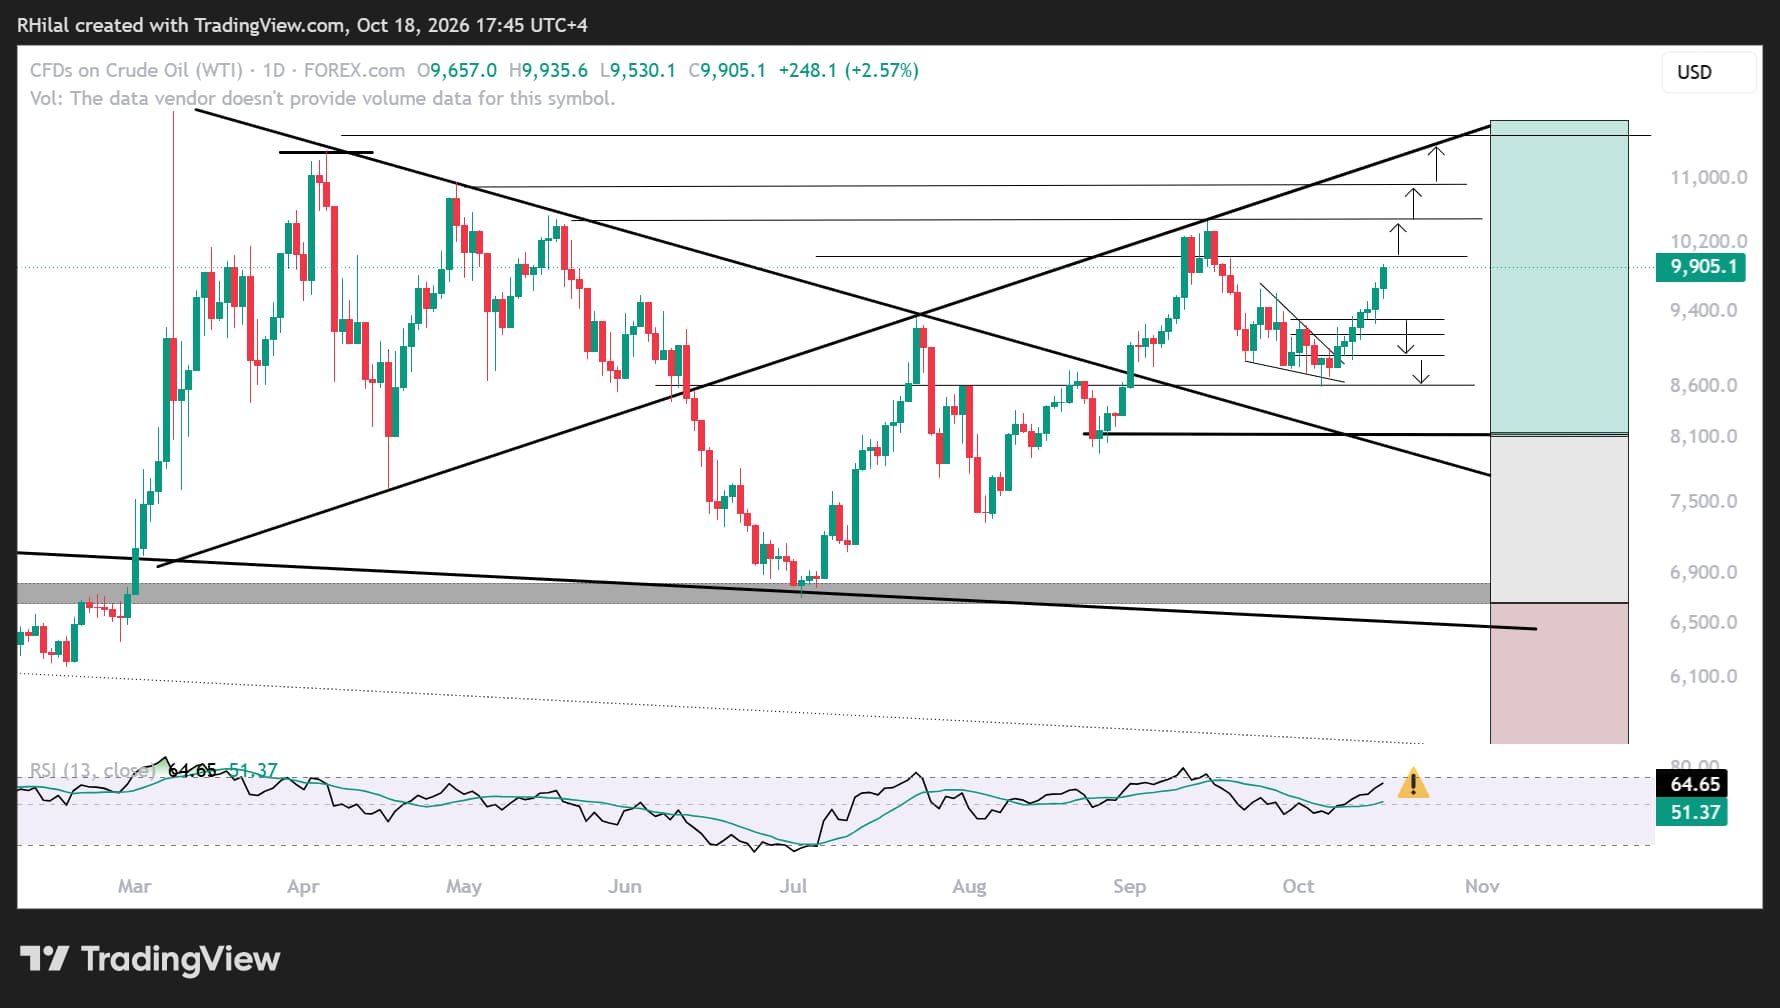
WTI has moved towards the psychological 100 level, while continuing to lag Brent’s test of the September high near 108. A sustained move above 100 and then 105 would shift attention back toward this year’s high near 120.
That area could test either a major double-top reversal pattern or a potential multi-decade breakout, given its alignment with a widely respected resistance zone dating back to 2011.
The 105 level may act as a ceiling if WTI remains within a broader corrective pattern from this year’s high. It also aligns with the 61.8% extension of the cycle running from the April 2025 low to the March 2026 high and the July 2026 low.
On the downside, breaks below 95, 91 and 89 would bring the bearish scenario into sharper focus. If that move coincides with geopolitical de-escalation, 86 and 80 would become the next potential downside levels, respectively.
XLE Energy Sector ETF: Daily Time Frame – Log Scale
Source: TradingView
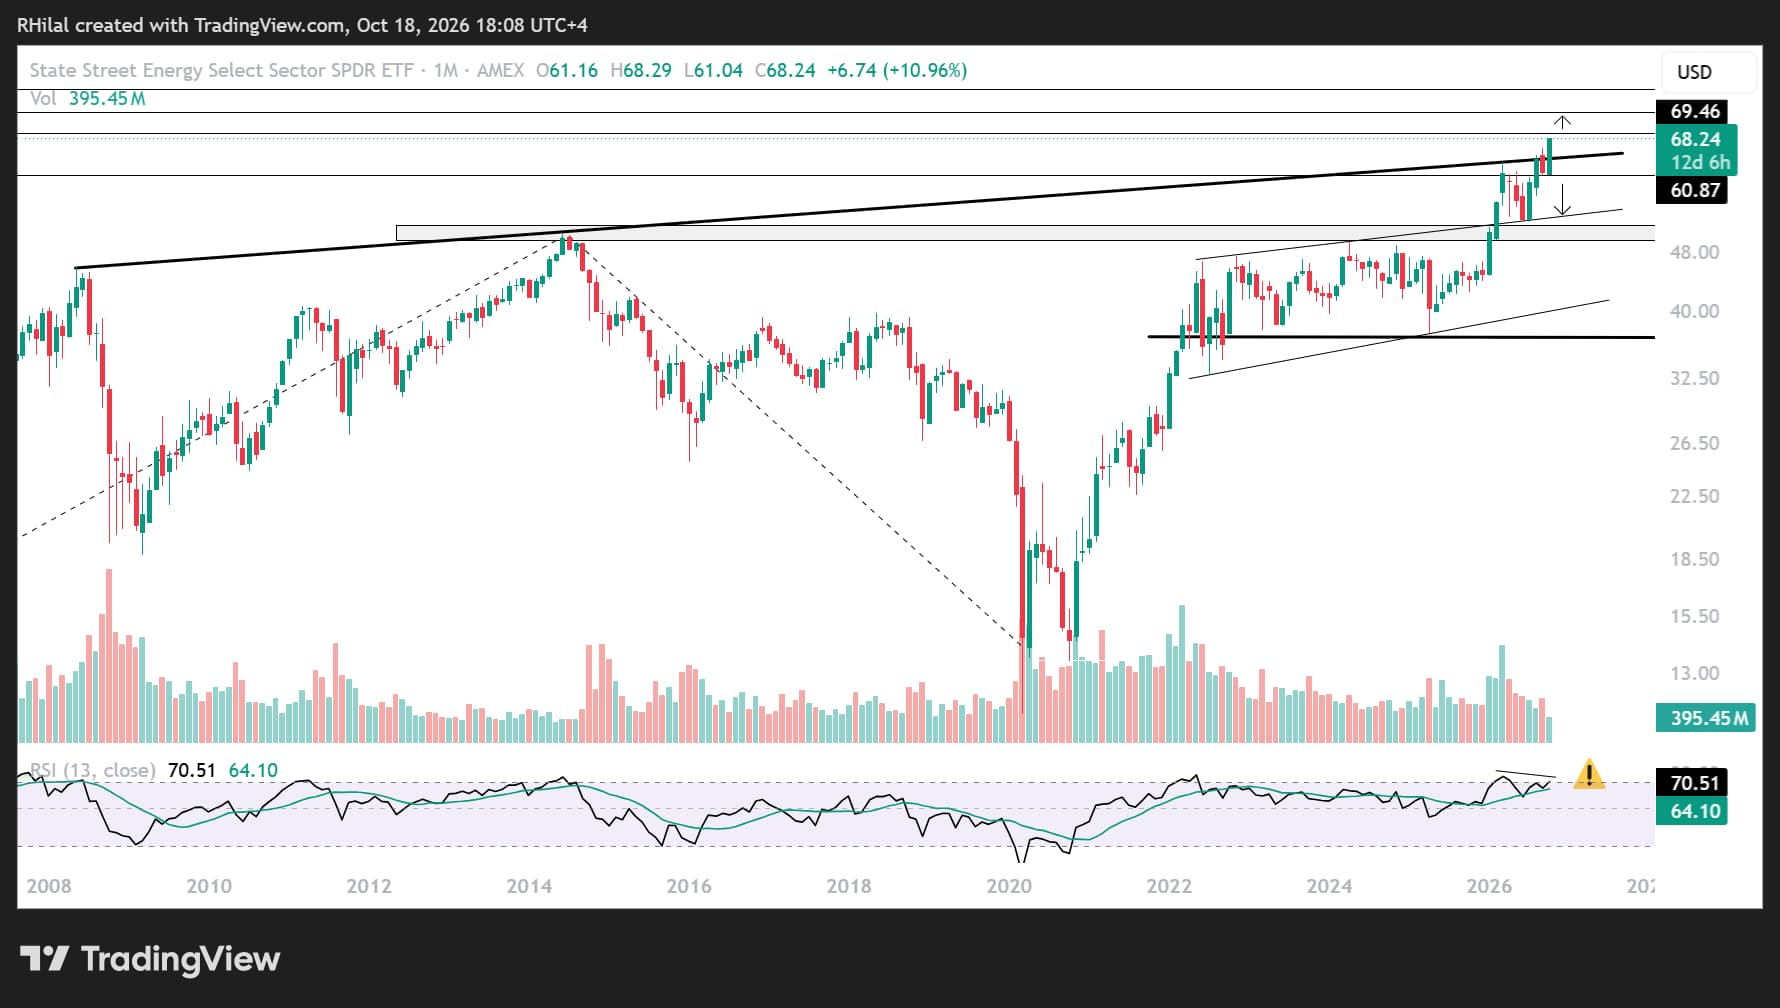
Upside risks have returned for XLE after price moved back above 66 and reclaimed the long-term resistance zone connecting major highs since 2008. The breakout supports the case for further gains, although a monthly RSI bearish-divergence risk remains after the indicator reached overbought levels last seen in 2022.
That signal calls for caution, particularly as WTI and Brent approach overbought momentum territory and geopolitical developments continue to drive sharp moves in energy markets. The approach of the Israeli election and US midterms may add to short-term volatility; it does not, on its own, confirm that tensions or supply risks will ease.
A move back below the reclaimed resistance zone and the psychological 60 level would weaken the bullish case and point to a possible broader reversal across the energy sector toward year-end.
Written by Razan Hilal, CMT
Follow on X: @Rh_waves
Latest market news




The complete CFD trading experience
Award-winning platforms, competitive spreads, low commissions and dedicated support.
We live and breathe the markets and are dedicated to helping traders realise their ambitions as we continue to set the industry bar.
Economic calendar
Web Trader platform
Our sophisticated web-based platform is packed with features.
Related articles
Crude Oil Weekly Outlook: Brent Tests September Highs, WTI Tops $100, and XLE Reclaims 18-Year Resistance
Crude Oil Weekly Outlook: Brent is testing its September highs, WTI has moved towards $100, and XLE has reclaimed its 18 year resistance. Explore the key levels that could define the next move in oil.
Crypto Analysis: Market Caution Extends Even to Bitcoin
We are now halfway through October, and one of the clearest themes across the cryptocurrency market has been the lack of meaningful price action. The absence of direction has become increasingly evident in short-term trading, and even Bitcoin, the market’s benchmark asset, has failed to generate the type of moves needed to restore confidence across the sector.

S&P 500, Nasdaq, Dow and Russell 2000 For the Week Ahead
Stocks started to shake last week and there was even a hint of this in the prior week. The question now is whether we’re at the point where buyers may abandon pullbacks as get closer to mid-term elections.

StoneX Europe Ltd may make third party material available on this website which may contain information included but not limited to the conditions of financial markets. The material is for information purposes only and does not contain, and should not be construed as containing, investment advice and/or investment recommendation and/or an investment research and/or an offer of or solicitation for any transactions in financial instruments; any decision to enter into a specific transaction shall be made by the client following an assessment by him/her of their situation.
StoneX Europe Ltd makes no representation or warranty and assumes no liability as to the accuracy or completeness of the information provided, nor any loss arising from any investment based on a recommendation, forecast or other information supplied. You should always seek independent advice as to your suitability to speculate in any related markets and your ability to assume the associated risks, if you are at all unsure. We are not under any obligation to update any such material. Any opinion made may be personal to the author and may not reflect the opinion of StoneX Europe Ltd.