


DXY, Nasdaq Price Forecast: Dollar Hits 13-Month Highs as Nasdaq Slips 1,000 Points
DXY and Nasdaq Price Forecast: The US dollar tests 13-month highs above 101 as rising rate hike expectations pressure technology stocks and risk assets.
Share this:

The US Dollar Index (DXY) is testing fresh 13-month highs above 101, while the Nasdaq has fallen nearly 1,000 points toward the critical 29,400 support zone as expectations for a Federal Reserve rate hike continue to build.
I cover these charts live in the Daily MENA Market Call:
CME FedWatch Tool
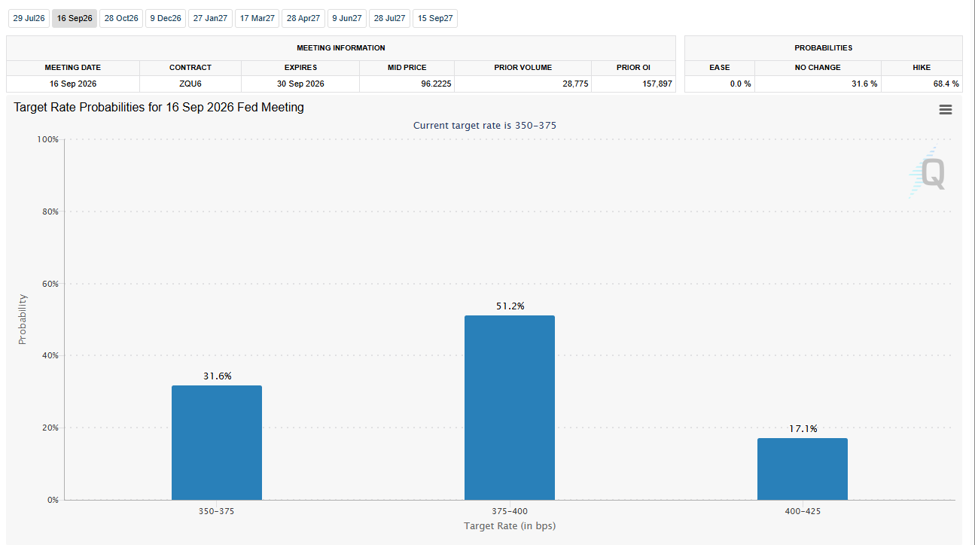
Source: CME
Following Kevin Warsh's first FOMC meeting, markets have increasingly priced in the possibility of a 25-basis-point rate hike before year-end, potentially lifting the Fed Funds rate from 3.75% toward 4.00%.
As a result, US 2-year Treasury yields are testing fresh 2026 highs, while 10-year and 30-year yields continue to lag behind. This divergence supports a constructive short-term outlook for the US dollar, although it does not yet confirm a broader long-term bullish trend.
Should 10-year Treasury yields begin to catch up, the resulting rise in long-term borrowing costs could place additional pressure on high-growth and AI-related valuations, increasing downside risks for major US indices, including the Nasdaq. That pressure is also increasingly visible on the SPCX chart, tracing a 30% + drawdown, reflecting cautious sentiment for elevated future valuations in a higher for longer rate environment.
Key Levels to Watch
- A DXY hold above 101.30 exposes 102.80–104.50.
- A DXY breakdown below 100.20 exposes 99.30.
- A Nasdaq breakdown below 29,400 exposes 29,200–28,600.
- A Nasdaq recovery above 29,700 opens the door toward 29,900–30,000.
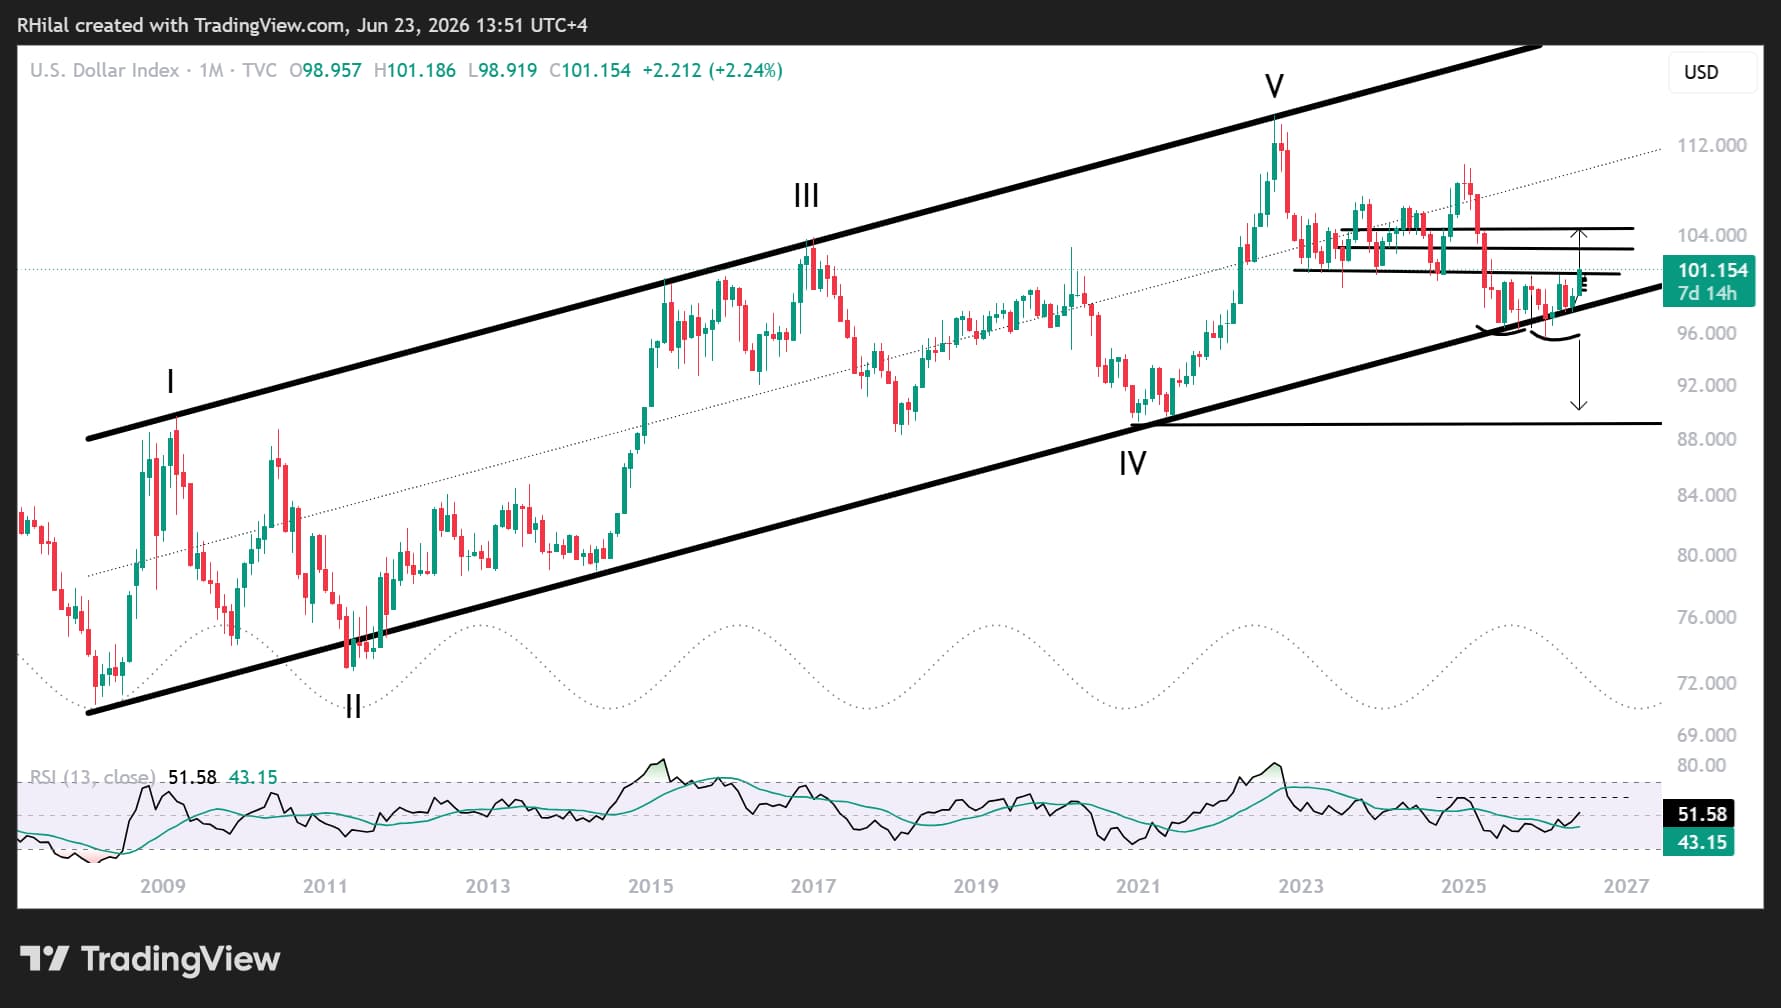
DXY Price Forecast: Monthly Time Frame – Log Scale
Source: TradingView
Why the 101.20 Zone Matters
As the old saying goes, the trend is your friend.
The DXY has respected a rising trend structure since 2008 and is now testing:
- A multi-year support-turned-resistance zone near 101 that has been in place since 2022.
- The 38.2% Fibonacci retracement of the decline between the 2025 high and the 2026 low.
- The potential neckline of a double-bottom formation developing throughout the past year.
A breakout above 101.20 would expose the next major Fibonacci resistance levels near:
- 102.80 (50%)
- 104.50 (61.8%)
This scenario could accelerate downside pressure on GBPUSD toward 1.29 and 1.27 while supporting a continuation higher in USDJPY toward 170 before longer-term projections toward 180 come into focus.
On the downside, DXY would need to break below 100 and then 99.30 to re-establish a bearish outlook, potentially supporting a recovery in major currencies and precious metals.
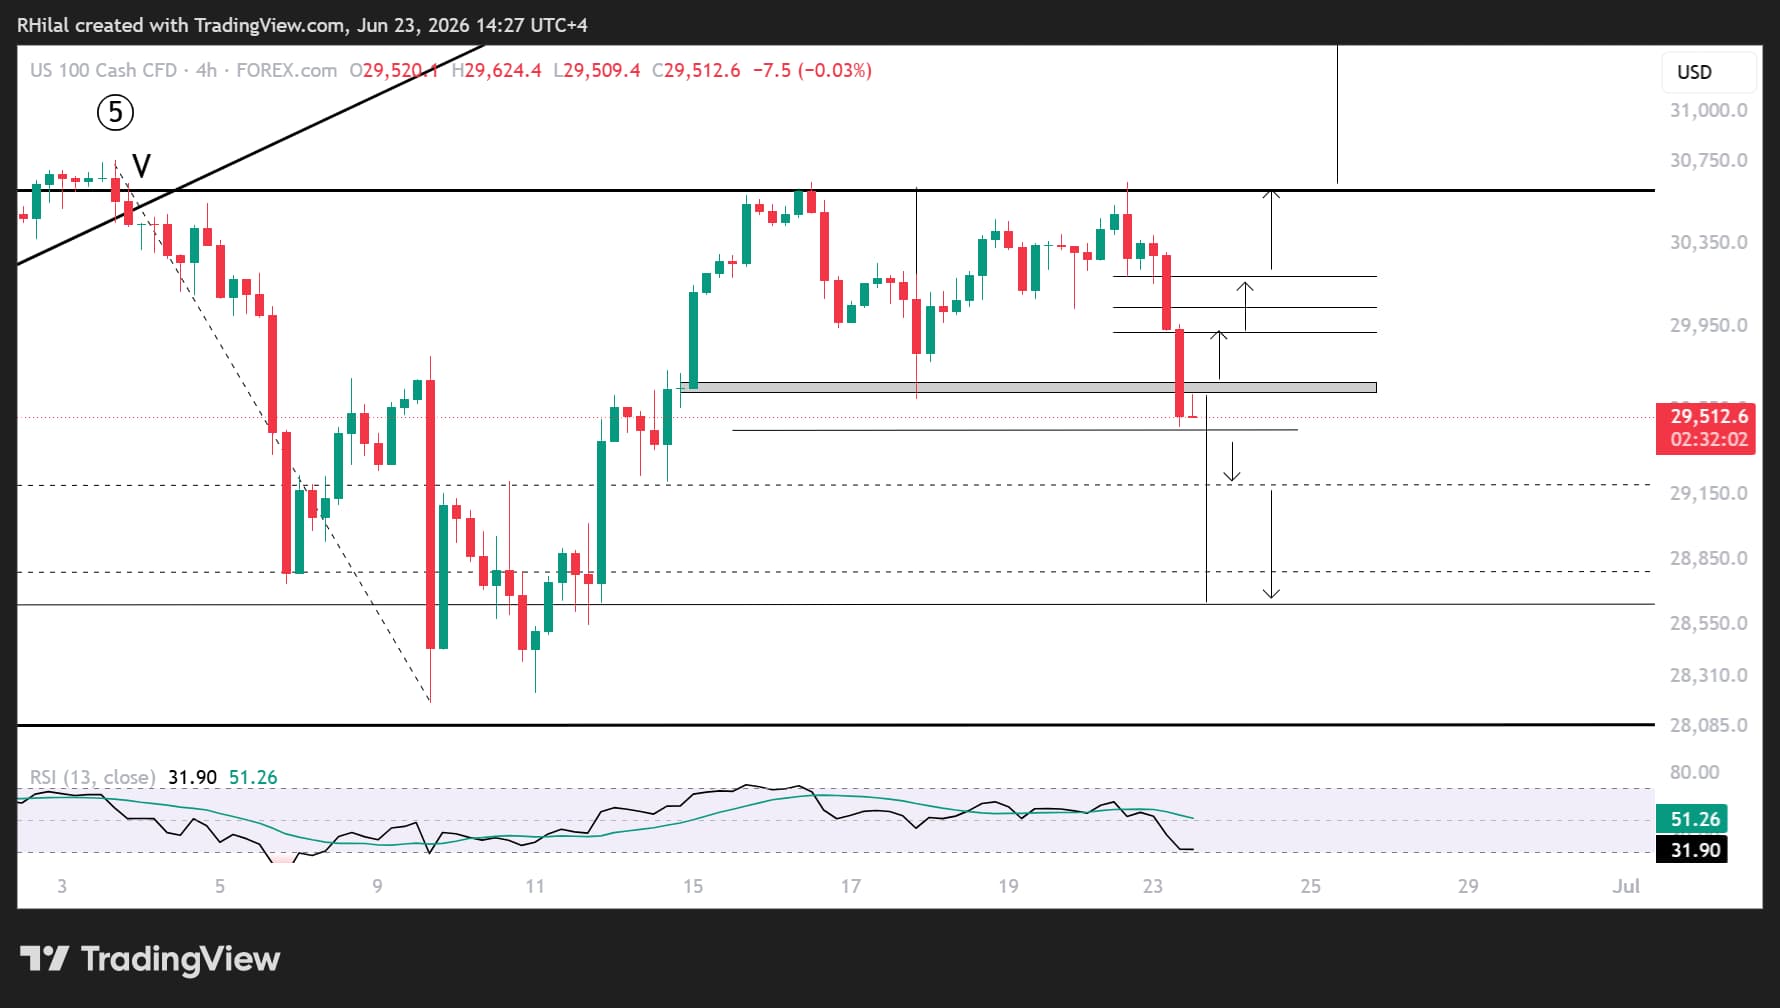
Nasdaq Price Forecast: 4-Hour Time Frame – Log Scale
Source: TradingView
Nasdaq Faces Double-Top Risks Below 30,700
The Nasdaq failed to break above the record high near 30,700 for a second consecutive time, increasing the risk of a potential double-top formation with a neckline near 29,400.
Current price action is attempting to rebound from the 29,400 support zone. However, a confirmed breakdown below this level could expose:
- 29,200
- 28,600
before a more meaningful bullish rebound can emerge.
Bearish Scenario – Breakdown Below 29,400
A sustained move below 29,400 would reinforce the double-top pattern and increase the probability of a deeper corrective move.
The 29,200 level may initially act as a dip-buying zone. However, failure to stabilize there could accelerate downside momentum toward 28,600, a level that may determine whether the broader uptrend remains intact.
Momentum Still Supports the Bullish Case
Despite the recent selloff, momentum indicators continue to show signs of stabilization.
The RSI is attempting to rebound above its moving average and key resistance levels, while remaining above the neutral 50 mark on both the daily and 4-hour timeframes.
This keeps the bullish scenario valid for now, provided support levels continue to hold.
Bullish Scenario – Reclaiming 29,700 and 30,000
On the upside, the Nasdaq must hold above 29,400 and reclaim 29,700 followed by 30,000 to revive bullish momentum.
A successful recovery could bring 30,600 back into focus, where markets may face another pullback risk.
Alternatively, a confirmed breakout above the record highs could trigger another 1,000-point advance toward:
- 31,500
- 31,700
These targets align with the 100% Fibonacci extension of the cycle spanning April 2025, January 2026, and March 2026.
A successful move into this region would reinforce the longer-term bullish trend and signal that investors remain willing to buy dips despite elevated valuations and tighter financial conditions.
DXY and Treasury Yields Remain the Key Drivers
For now, the interaction between the US dollar, Treasury yields, and rate hike expectations remains the dominant theme across financial markets.
A continued rise in DXY and long-term bond yields could reinforce pressure on high-growth sectors and risk assets, while a rejection from current resistance levels may provide temporary relief for the Nasdaq and broader equity markets.
With Treasury yields rising and the dollar approaching a critical technical inflection point, the next move in DXY may determine whether risk assets continue their current correction or return to a broader bullish trend.
Written by Razan Hilal, CMT
Follow on X: @Rh_waves
Related tags:



The complete CFD trading experience
Award-winning platforms, competitive spreads, low commissions and dedicated support.
We live and breathe the markets and are dedicated to helping traders realise their ambitions as we continue to set the industry bar.
Economic calendar
Web Trader platform
Our sophisticated web-based platform is packed with features.
Related articles
Crude Oil Weekly Outlook: Bearish-to-Neutral Setup Holds
Crude Oil Weekly Outlook: The bearish-to-neutral setup holds as OPEC keeps November quotas steady, Gulf exports recover to near prewar levels, US crude inventories continue to rise gradually, and prices remain below a seven-month barrier.

USD/JPY weekly outlook: Quarter turn scrambles rates regime
USD/JPY’s tight relationship with front-end US rates broke down sharply last week, but quarter-turn flows and positioning suggest the disconnect may prove temporary.


Gold Update: XAU/USD Remains Under Pressure Even After the NFP Report
As the trading week comes to an end, weakness around gold price action remains evident in the short term. This can be seen in the performance of the past two sessions, where the metal has declined by approximately 0.3%. Although the move has not been particularly aggressive, it highlights that buying pressure continues to struggle to regain control of the market.

StoneX Europe Ltd may make third party material available on this website which may contain information included but not limited to the conditions of financial markets. The material is for information purposes only and does not contain, and should not be construed as containing, investment advice and/or investment recommendation and/or an investment research and/or an offer of or solicitation for any transactions in financial instruments; any decision to enter into a specific transaction shall be made by the client following an assessment by him/her of their situation.
StoneX Europe Ltd makes no representation or warranty and assumes no liability as to the accuracy or completeness of the information provided, nor any loss arising from any investment based on a recommendation, forecast or other information supplied. You should always seek independent advice as to your suitability to speculate in any related markets and your ability to assume the associated risks, if you are at all unsure. We are not under any obligation to update any such material. Any opinion made may be personal to the author and may not reflect the opinion of StoneX Europe Ltd.