



EUR/USD Tests 18-Year Support, Raising Potential Reversal Risks Across USD/JPY and GBP/USD
USD/JPY and GBP/USD Outlook: EUR/USD is testing a key confluence zone and an 18-year support level, raising the risk of a near-term reversal in the dollar and major currency pairs, including USD/JPY and GBP/USD.
Share this:

Rising US inflation readings and market bets on a December Fed rate hike, with Fed Waller calling for a 50-bps rate hike, UK inflation at a one-year high near 3.6%, and Japanese Tokyo and national core CPI at one-year highs keep a broader hawkish central-bank outlook on the horizon.
However, with markets nearly fully pricing in a December Fed rate hike and sentiment stretched in both the dollar and euro, we may be seeing short-term trend continuation alongside the risk of a longer-term reversal. Weekly EUR/USD momentum is at oversold levels last seen in 2022. Key support on GBP/USD and resistance on USD/JPY are also in focus as potential confirmation points for a near-term reversal setup across EUR/USD and the US Dollar Index (DXY).
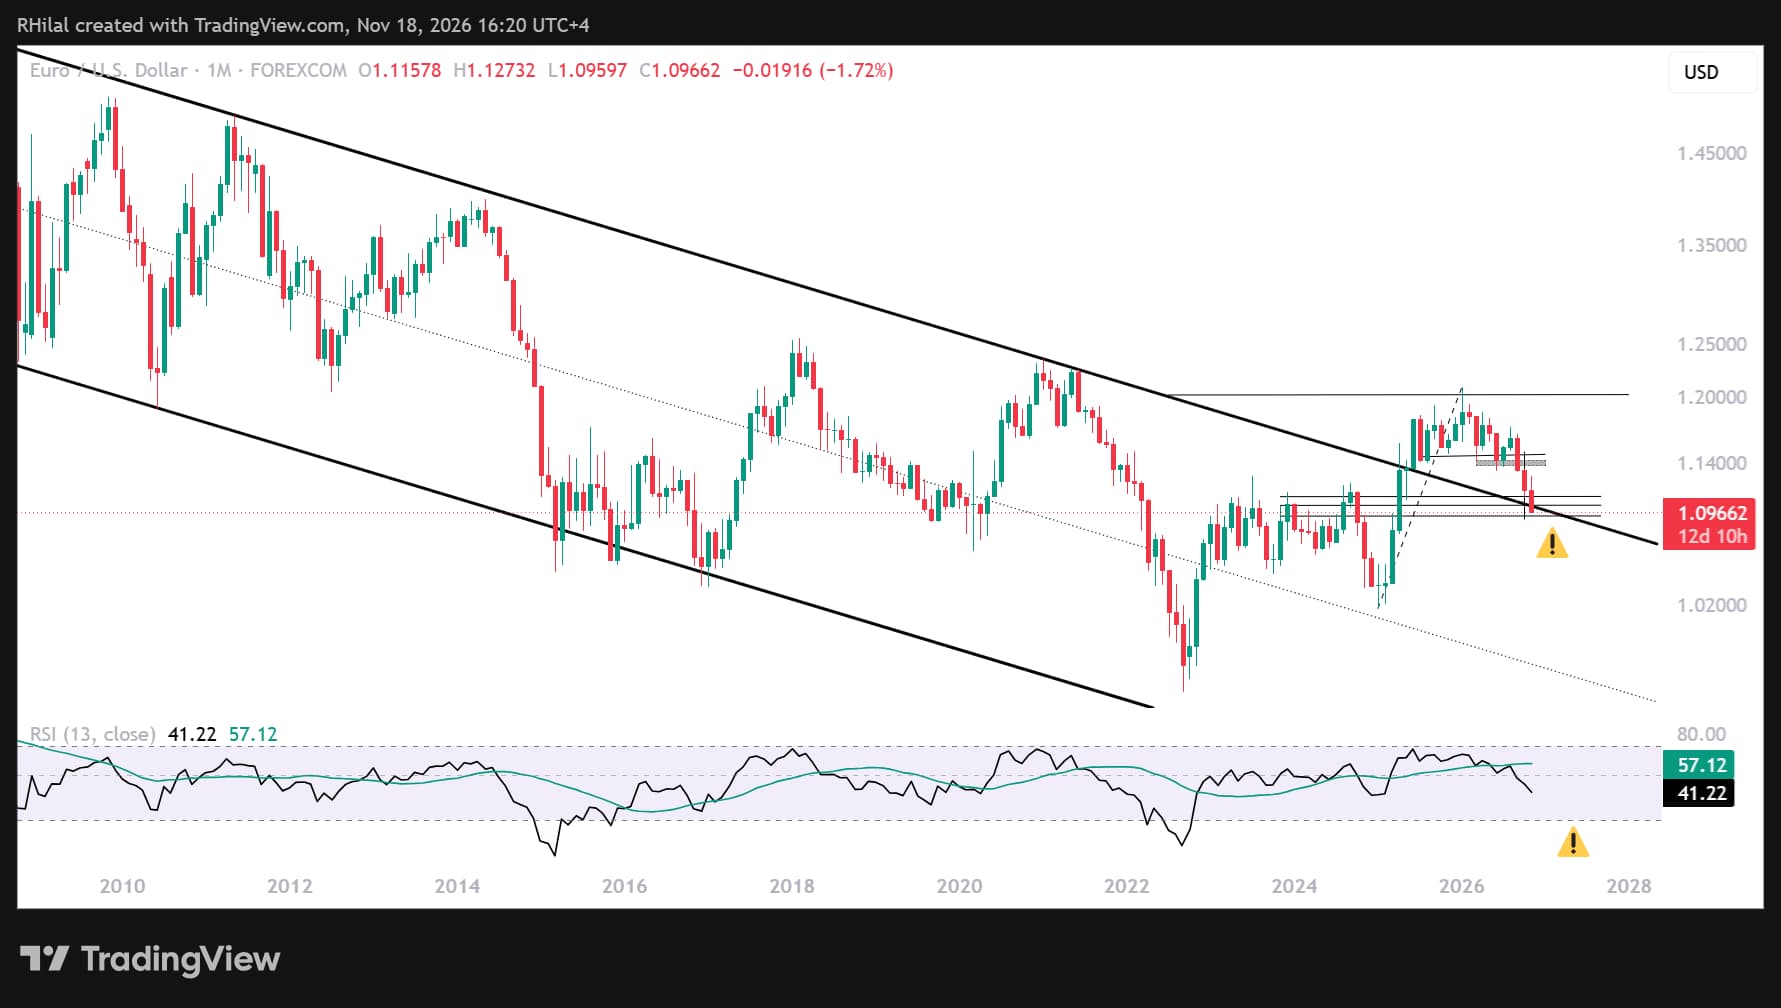
EUR/USD Outlook: Weekly Time Frame — Log Scale
Source: TradingView
EUR/USD’s extreme technical setup and positioning are raising the risk of a near-term bearish reversal in the dollar, with potential implications for major currency pairs. On the weekly chart, price is approaching the 1.0930–1.0900 support zone, which aligns with:
- Oversold momentum levels last seen in 2022, when EUR/USD was trading below parity
- An 18-year resistance line connecting lower highs from 2008 to 2025, which has turned into support in 2026
- The 61.8% retracement of the January 2025–January 2026 advance
- The 100% extension of the January 2026–July–August wave
A sustained close below this zone would likely shift the outlook toward a longer-term bearish trend, supporting the dollar’s rally and weighing on major currency pairs.
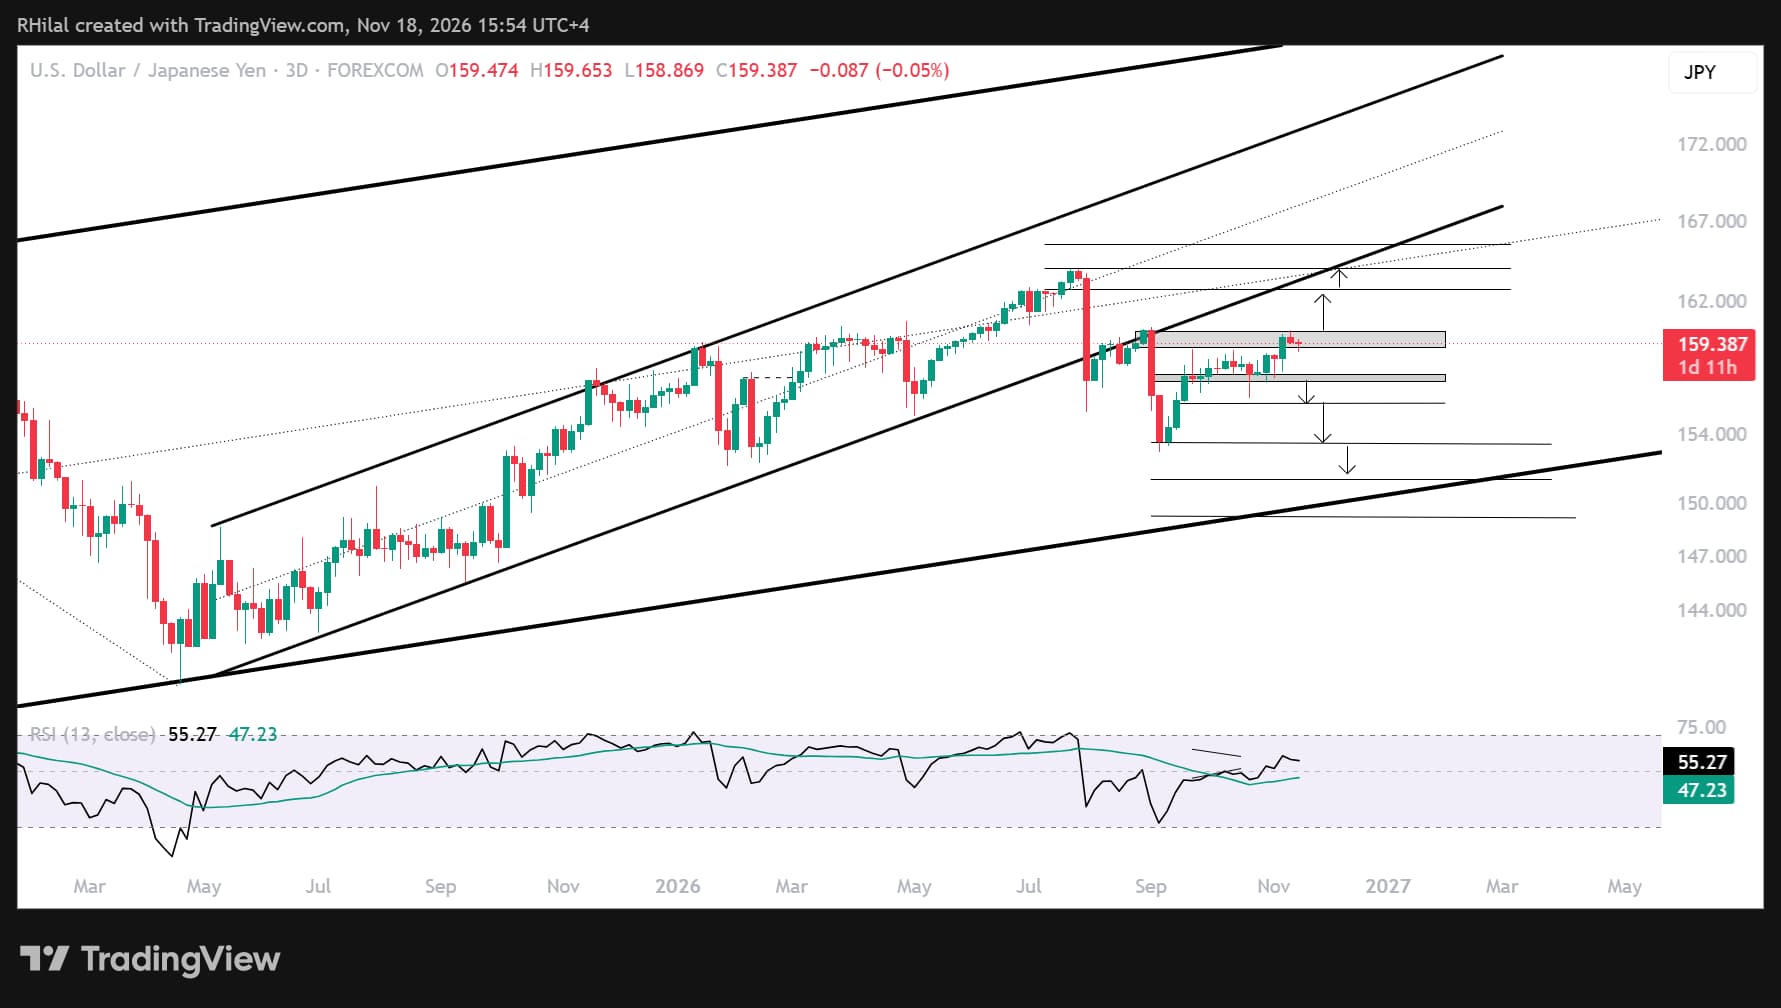
USD/JPY Outlook: Weekly Time Frame — Log Scale
Source: TradingView
USD/JPY is consolidating below the psychological 160 level, which aligns with:
- The 61.8% retracement of the July–September decline. This points to potential bearish continuation unless price reclaims 160. A move higher would bring the April 2025–August 2026 trendline into focus near 162.70, followed by 164. These levels align with the yearly highs and a major pullback or trend-continuation test.
- The 27.2% Fibonacci extension of the wave spanning April 2025, July 2026 and September 2026. The upside scenario is outlined above. On the downside, a break below 157.15–155.70 could bring the yearly low and the lower boundary of a respected channel in place since 2022 into focus. The next major support zone is near 153–151–149.
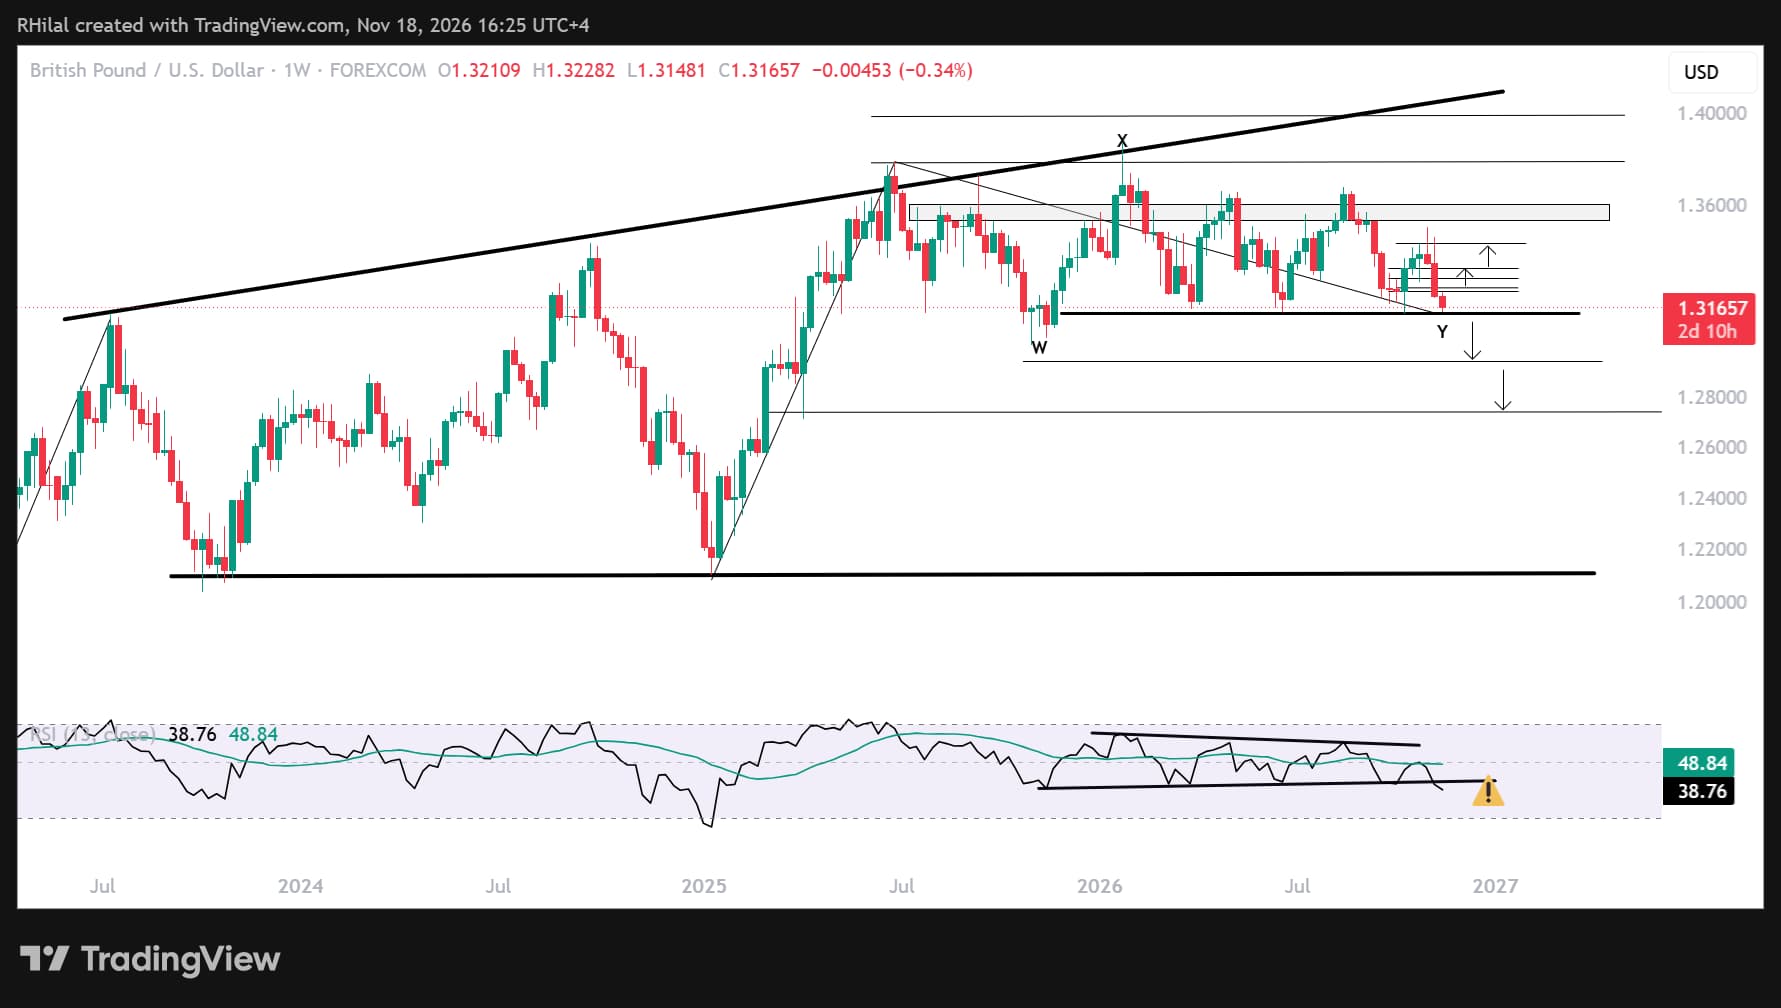
GBP/USD Outlook: Weekly Time Frame — Log Scale
Source: TradingView
GBP/USD may be leading the way in terms of bullish reversal risk, with price once again rejecting the 1.31 support zone. This area aligns with the lower boundary of a respected sideways consolidation in place since November 2025.
A close below this year-long range boundary would confirm a longer-term bearish shift. Price has held above the 1.3130 area, near the 38.2% Fibonacci retracement of the January–June 2025 advance. A break lower could put the 50% and 61.8% retracements near 1.2950 and 1.2750, respectively, into focus. It would also coincide with a bearish break in weekly RSI below its respected year-long consolidation, potentially setting up another major dip-buying opportunity.
On the upside, holding within the consolidation could maintain a neutral-to-bullish bias. Resistance at 1.3250, 1.3330, 1.3430 and 1.3600 will come into focus before a longer-term bullish outlook and a breakout above the 2023–2026 resistance can be confirmed.
A tentative hold for USD/JPY near the psychological 160 level, a historic test of EUR/USD support turned resistance from 18 years ago, and GBP/USD’s test of its consolidation range in place since November 2025 all put markets at a critical juncture. Price action may define whether support holds or a steeper sell-off develops, potentially shifting longer-term outlooks and signaling distress not only in currencies, but also in precious metals approaching key 2026 extremes and US indices holding near their November 2026 lows.
Rebound or further sell-off? Either way, waiting for price confirmation may help reduce headline noise and support risk-management decisions.
Written by Razan Hilal, CMT
X: @Rh_waves
Latest market news



The complete CFD trading experience
Award-winning platforms, competitive spreads, low commissions and dedicated support.
We live and breathe the markets and are dedicated to helping traders realise their ambitions as we continue to set the industry bar.
Economic calendar
Web Trader platform
Our sophisticated web-based platform is packed with features.
Related articles
Rates Shock, Metals Rout Leave Aussie Dollar Under the Pump
The global environment is becoming increasingly hostile for the Aussie. With AUD/USD breaking major support and AUD/JPY threatening further downside, today's jobs report faces an uphill battle to change the picture.


Euro Short-term Outlook: EUR/USD Plunges to 19-Month Low—Bears Face Critical Test 11 18 2026
The Euro selloff is now approaching pivotal support, raising the prospect of downside exhaustion as the November decline extends.


Japanese Yen Technical Outlook: USD/JPY Rally Stalls Near 160—Breakout Support in Focus 11 18 2026
USD/JPY has set its weekly range just above former resistance, with a range break likely to determine whether November’s rally has further to run.
StoneX Europe Ltd may make third party material available on this website which may contain information included but not limited to the conditions of financial markets. The material is for information purposes only and does not contain, and should not be construed as containing, investment advice and/or investment recommendation and/or an investment research and/or an offer of or solicitation for any transactions in financial instruments; any decision to enter into a specific transaction shall be made by the client following an assessment by him/her of their situation.
StoneX Europe Ltd makes no representation or warranty and assumes no liability as to the accuracy or completeness of the information provided, nor any loss arising from any investment based on a recommendation, forecast or other information supplied. You should always seek independent advice as to your suitability to speculate in any related markets and your ability to assume the associated risks, if you are at all unsure. We are not under any obligation to update any such material. Any opinion made may be personal to the author and may not reflect the opinion of StoneX Europe Ltd.