



Euro Price Outlook: EUR/USD 1.1000 Resistance Impact
EUR/USD was strong at last week’s open, until the 1.1000 handle came into play, and the trend has been going the other way ever since.
Share this:

Euro, EUR/USD Talking Points:
- The bullish trend in EUR/USD extended last week, until the 1.1000 psychological level came into play.
- Since the 1.1000 inflection prices have been pulling back and prices are now moving towards the 38.2% retracement of the recent rally at 1.0800. There’s another support zone just below that, around the 1.0750 psychological level, and if bulls can hold that they can keep the door open for topside.
- I’ll be discussing these themes in-depth in the weekly webinar. It’s free for all to register: Click here to register.
It took about a month for EUR/USD bears to finally relent. The sell-off that started in July was smooth and consistent, and with US data remaining strong while European data began to show weakness, there was little standing in the way of that clean trend being built.
Matters had begun to get stretched towards the end of Q3 and that’s when sellers finally started to see a bit of turbulence. The 1.0500 psychological level soon became a sticking point in early-Q4 trade, with a series of higher-lows building that allowed for an eventual stall in that short-side move. The stall, however, lasted for pretty much all of October, and as the door opened to November trade another theme began to show.
The FOMC rate decision on November 1st helped to hold a higher-low in the pair, but it was the NFP report a couple of days later that allowed for the breakout, and this pushed price into a key zone of resistance around the 1.0750 level. That was a higher-high and when the pair pulled back from that, it held higher-lows around a spot of prior resistance, taken from around 1.0673. This also allowed for the build of a falling wedge formation, which also took on a similar tone as a bull flag. And it was the CPI report on November the 14th that pushed that next breakout, and this time bulls were able to stretch all the way up to a confluent zone of resistance at 1.0943-1.0960.
There remained a trend component, as a pullback from that resistance test found support at a key zone, and the topside move extended into a re-test of the 1.1000 handle last week. Along the way, RSI had moved into overbought conditions on the daily chart which helps to illustrate just how quickly this move came in, and paradoxically, how hot the market had become when just a month earlier it seemed that bulls had little interest in bidding the market higher.
The pullback from 1.1000 continues to pick up steam and at this point, price is pushing down for a test of the 38.2% Fibonacci retracement of the recent bullish move. That plots at 1.0800 and there’s a couple of other support mechanisms at-play, such as the 200-day moving average (in orange, below) and after 1.0800, is a major confluent zone around the same 1.0750 zone that came into play after the October NFP report.
EUR/USD Daily Price Chart
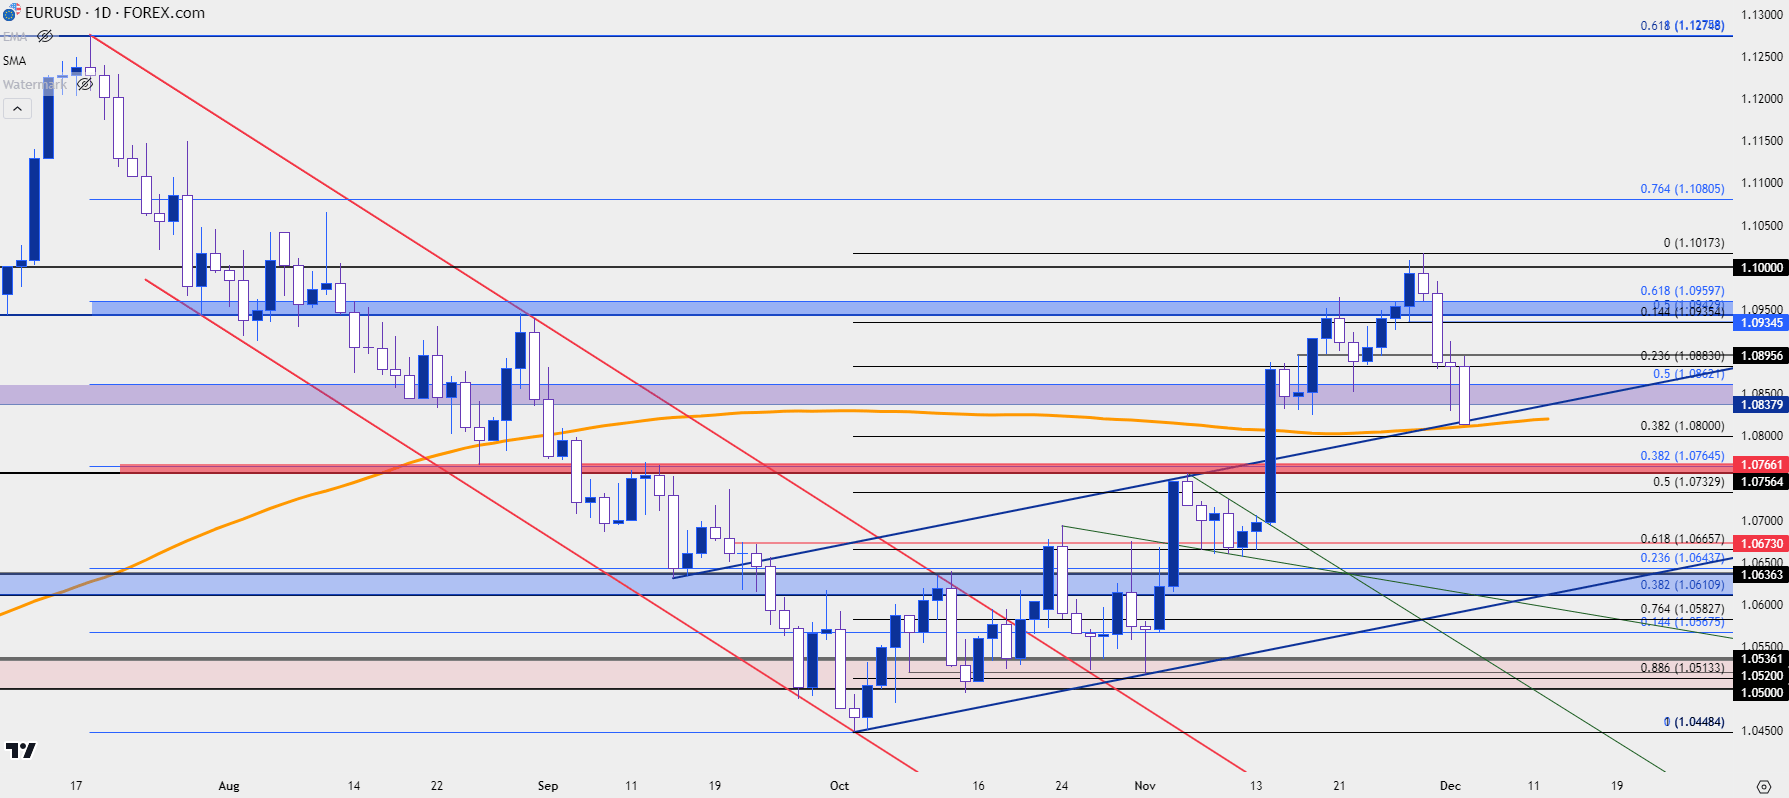 Chart prepared by James Stanley, EUR/USD on Tradingview
Taking a step back to the weekly chart, and taking a more simplistic look at the matter, we can see last week’s build of an outside bearish bar after the 1.1000 resistance test had come into play. This keeps the door open for sellers with a focal point on that next spot of support potential, around the 1.0750 zone, which is a psychological level as well as a prior high and the 38.2% Fibonacci level of the sell-off the started in July.
If bears can get below that, 1.0638 remains as a big spot: This is the swing-low from late-May and it’s also near the 23.6% retracement of the July sell-off. This was also the 2020 swing low that showed up during the chaos of Covid price action, but it remains a sticking point in the event that sellers can evoke a push below 1.0750.
If 1.0638 can come into play quickly, it may even bring with it some reversal potential; but that’s going to be dependent on how 1.0750 trades as that is a major spot of confluence, and could be of interest for bulls after a pullback from the 1.1000 handle.
EUR/USD Weekly Price Chart
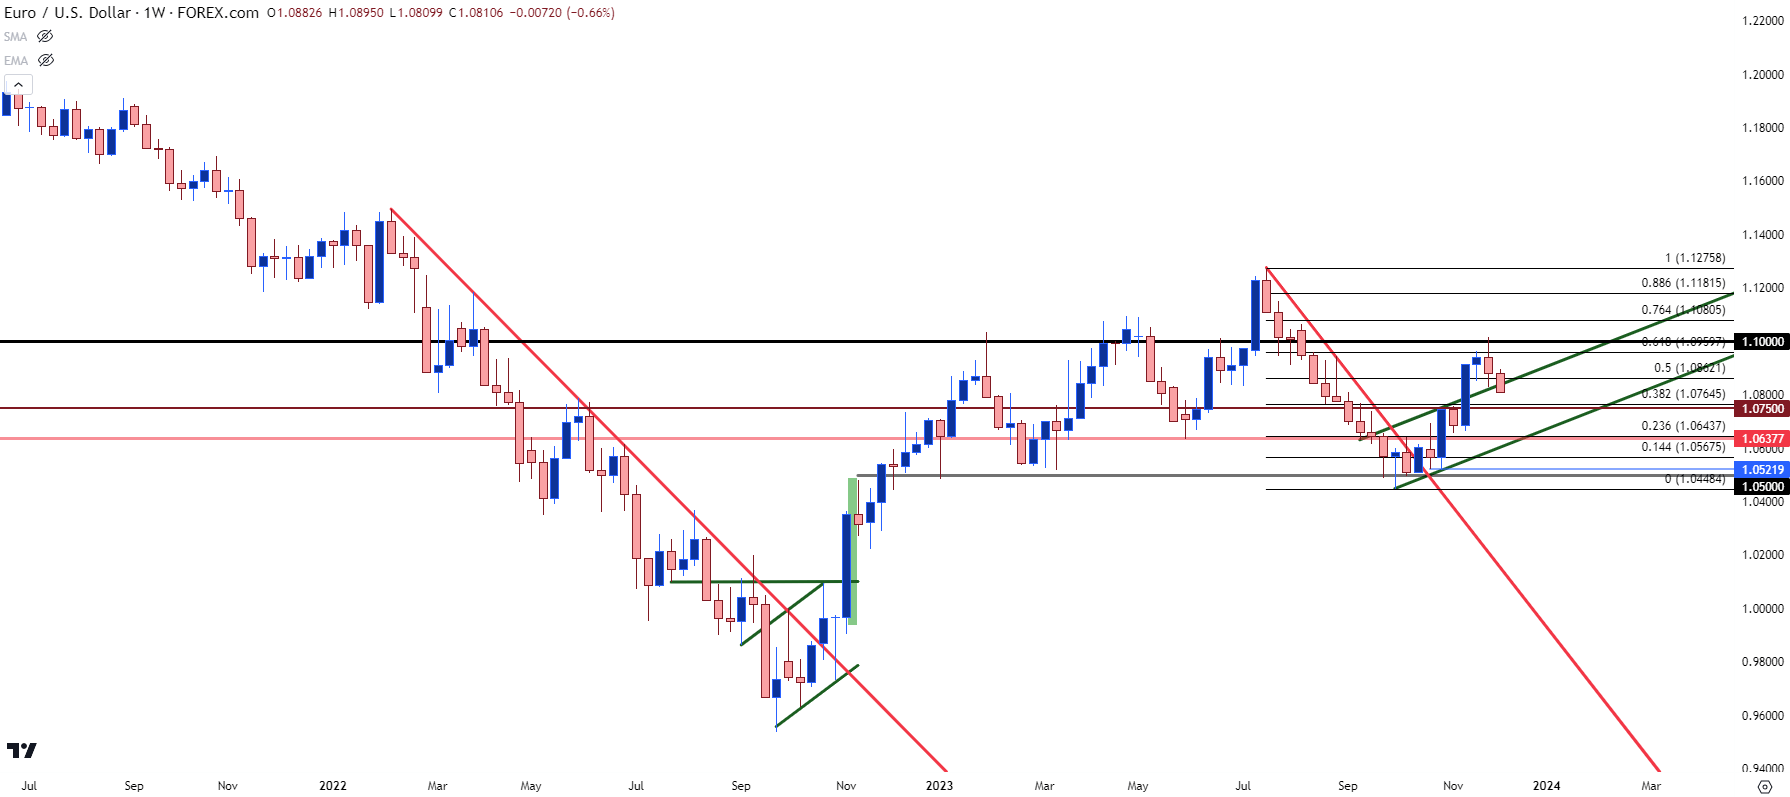 Chart prepared by James Stanley, EUR/USD on Tradingview
--- written by James Stanley, Senior Strategist
Related tags:

The complete CFD trading experience
Award-winning platforms, competitive spreads, low commissions and dedicated support.
We live and breathe the markets and are dedicated to helping traders realise their ambitions as we continue to set the industry bar.
Economic calendar
Web Trader platform
Our sophisticated web-based platform is packed with features.
Related articles

USD/JPY falters, EUR/USD awaits French bond verdict
The yen has reacted to falling US yields, but the euro faces a different problem. Could French government bond yields provide the additional push needed to break EUR/USD's downtrend?

EUR/USD Forecast: Euro Remains Under Pressure Amid Concerns Over French Debt
Recent trading sessions continue to present a challenging environment for the euro in the short term. This can be seen in the performance of EUR/USD, which has declined by approximately 0.5%, reflecting another loss of ground for the European currency and highlighting the continued strength of the U.S. dollar.


S&P 500 Pulls Back From Another Fresh ATH As Yields Soften
Both the S&P and Nasdaq set fresh ATHs on Wednesday, and despite relief in yields, stocks are pulling back again today.
StoneX Europe Ltd may make third party material available on this website which may contain information included but not limited to the conditions of financial markets. The material is for information purposes only and does not contain, and should not be construed as containing, investment advice and/or investment recommendation and/or an investment research and/or an offer of or solicitation for any transactions in financial instruments; any decision to enter into a specific transaction shall be made by the client following an assessment by him/her of their situation.
StoneX Europe Ltd makes no representation or warranty and assumes no liability as to the accuracy or completeness of the information provided, nor any loss arising from any investment based on a recommendation, forecast or other information supplied. You should always seek independent advice as to your suitability to speculate in any related markets and your ability to assume the associated risks, if you are at all unsure. We are not under any obligation to update any such material. Any opinion made may be personal to the author and may not reflect the opinion of StoneX Europe Ltd.