




Euro Technical Forecast: EUR/USD Tug-of-War Continues at Resistance
The rate cut rally drove EUR/USD to fresh highs this week. But, notably, bullish pressure slowed and resistance began to hit as the pair pulled back from the 1.1200 handle.
Share this:

EUR/USD, Euro Talking Points:
- EUR/USD has put in a strong Q3 outing even as the European Central Bank has pushed into a rate cutting cycle.
- USD-weakness has certainly held some drive here but after EUR/USD stalled at the 1.1200 level in August, bulls have not been able to break much fresh ground.
- I discussed the pair in this week’s US Dollar Price Action Setups article and video, and as shared there, EUR/USD remains one of the more attractive venues for those looking for a bounce in DXY or the US Dollar. GBP/USD and AUD/USD could make more attractive candidates for USD-weakness scenarios.
It’s been a strong Q3 for EUR/USD, even with the European Central Bank pushing a rate cutting cycle. Notably, buyers showed up to defend the 1.1000 level ahead of the European Central Bank’s rate cut in September, launching the move back up to resistance at the same 1.1200 handle that held the highs in August.
From a strategy standpoint, there could be more attractive venues for USD-weakness scenarios, as I looked at in this week’s US Dollar Price Action Setups. Both Aussie and Sterling are backed by economies not in a similar cutting posture as the Fed and ECB, and each of AUD/USD and GBP/USD have been able to drive trends up to fresh yearly highs even as EUR/USD remains in the confines of the 21-month range.
Of particular interest for this week was the re-appearance of a long-term resistance level at 1.1212. This is the 61.8% retracement of the lifetime move in the pair and it came into play on Wednesday, leading to a fast short-term reversal. The level saw a degree of defense later in the week when sellers were able to hold resistance around the same 1.1200 handle that was in-play in August, and this keeps the door open for lower-highs.
EUR/USD Monthly Price Chart
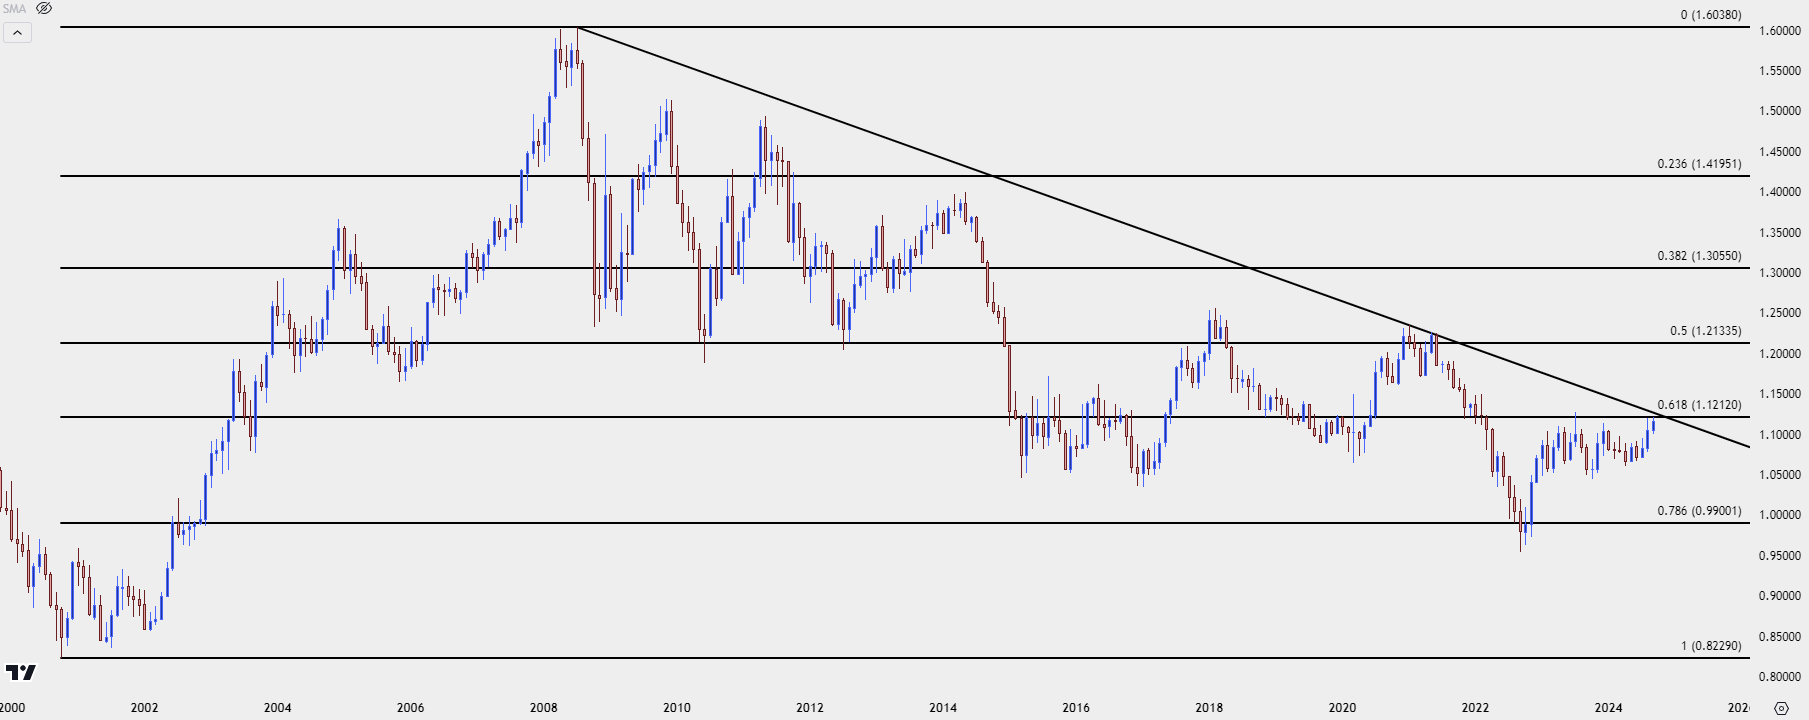 Chart prepared by James Stanley, EUR/USD on Tradingview
EUR/USD Weekly Doji
While that resistance level produced a strong reaction, bulls were not yet ready to relent. At this point the weekly bar is nearing the close as a doji and that’s probably not what buyers wanted to see after a failed breakout above the 1.1200 handle.
EUR/USD Weekly Price Chart
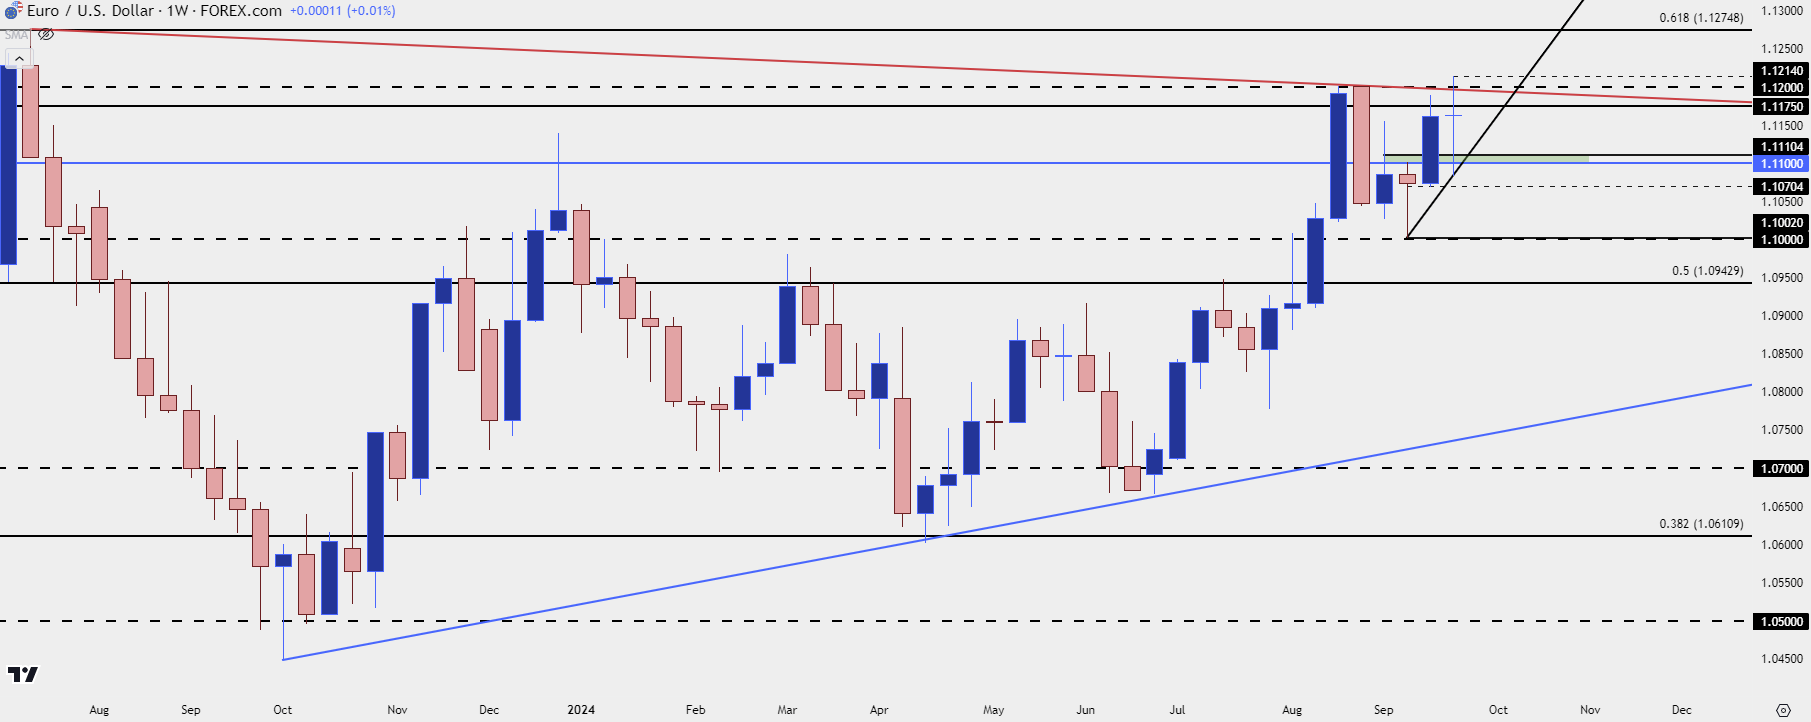 Chart prepared by James Stanley, EUR/USD on Tradingview
EUR/USD Daily – Strategy for Next Week
That bullish support becomes a bit more clear on the daily chart as there’s an upward-sloping trendline taken from the low of 1.1002 from a few weeks ago.
The lower-high structure discussed on Thursday retains potential as there hasn’t been much for bullish drive above 1.1175, which is below the 1.1200 resistance which is inside of the 1.1212 level. Notably, all of this shows inside of last year’s high at 1.1275 so the case can still be argued that we remain within the 21-month range. And on the fundamental side of that argument, it’s not like there’s a host of strong economic data points out of the Eurozone that could substantiate an argument of hawkishness around the European Central Bank.
So, if we do see a USD bounce next week through the Q4 open or through the Non-farm Payrolls report, range continuation in EUR/USD remains a viable venue. But for USD-weakness, there may simply be greener pastures elsewhere, such as a pair that’s recently been able to show bullish drive through fresh yearly highs.
EUR/USD Daily Price Chart
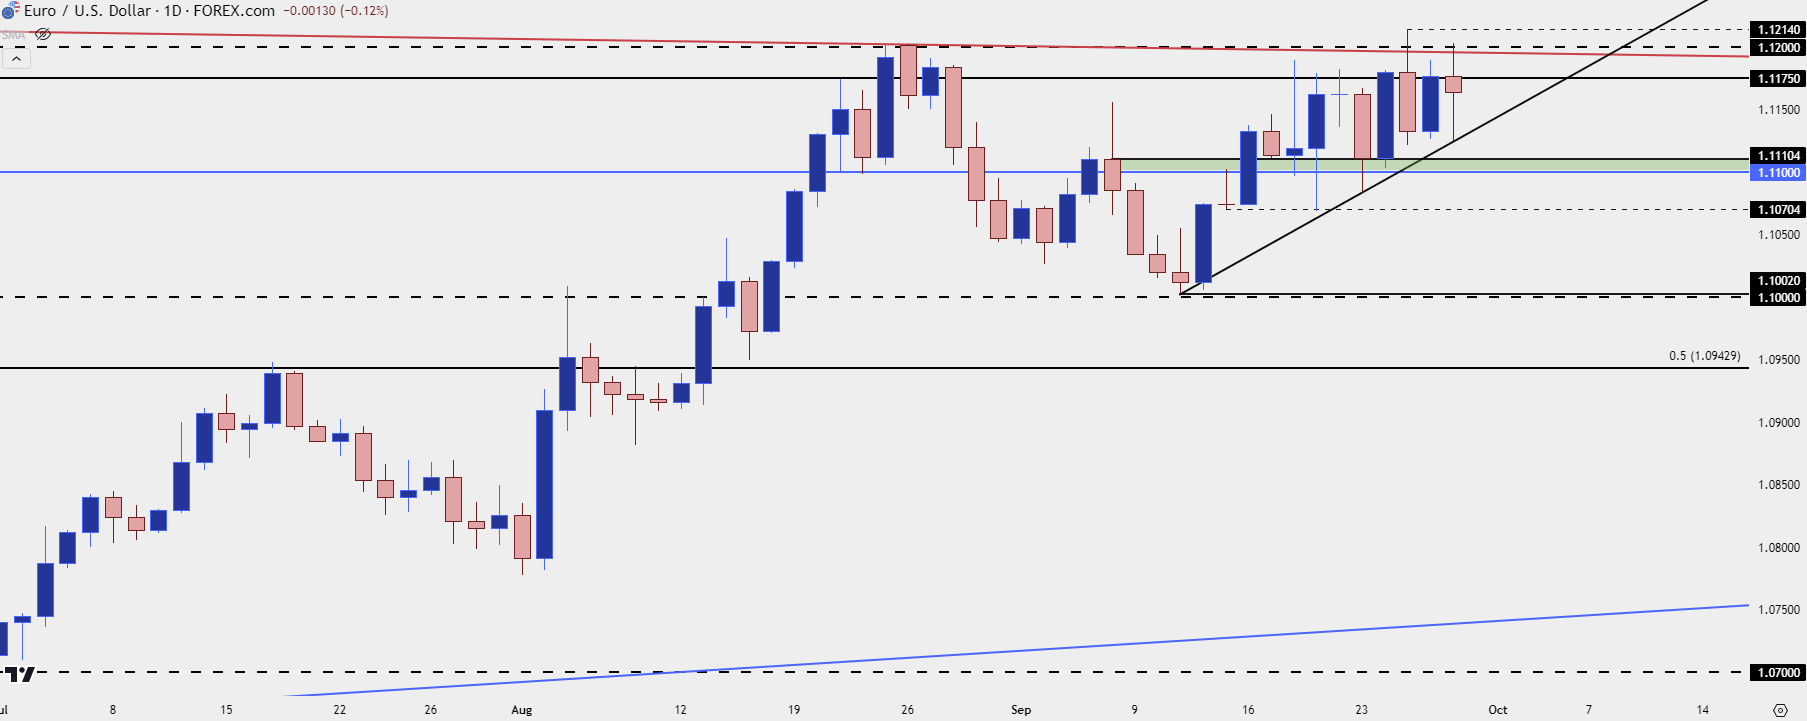
Chart prepared by James Stanley, EUR/USD on Tradingview
--- written by James Stanley, Senior Strategist
EUR/USD, Euro Talking Points:
- EUR/USD has put in a strong Q3 outing even as the European Central Bank has pushed into a rate cutting cycle.
- USD-weakness has certainly held some drive here but after EUR/USD stalled at the 1.1200 level in August, bulls have not been able to break much fresh ground.
- I discussed the pair in this week’s US Dollar Price Action Setups article and video, and as shared there, EUR/USD remains one of the more attractive venues for those looking for a bounce in DXY or the US Dollar. GBP/USD and AUD/USD could make more attractive candidates for USD-weakness scenarios.
It’s been a strong Q3 for EUR/USD, even with the European Central Bank pushing a rate cutting cycle. Notably, buyers showed up to defend the 1.1000 level ahead of the European Central Bank’s rate cut in September, launching the move back up to resistance at the same 1.1200 handle that held the highs in August.
From a strategy standpoint, there could be more attractive venues for USD-weakness scenarios, as I looked at in this week’s US Dollar Price Action Setups. Both Aussie and Sterling are backed by economies not in a similar cutting posture as the Fed and ECB, and each of AUD/USD and GBP/USD have been able to drive trends up to fresh yearly highs even as EUR/USD remains in the confines of the 21-month range.
Of particular interest for this week was the re-appearance of a long-term resistance level at 1.1212. This is the 61.8% retracement of the lifetime move in the pair and it came into play on Wednesday, leading to a fast short-term reversal. The level saw a degree of defense later in the week when sellers were able to hold resistance around the same 1.1200 handle that was in-play in August, and this keeps the door open for lower-highs.
EUR/USD Monthly Price Chart
EUR/USD Weekly Doji
While that resistance level produced a strong reaction, bulls were not yet ready to relent. At this point the weekly bar is nearing the close as a doji and that’s probably not what buyers wanted to see after a failed breakout above the 1.1200 handle.
EUR/USD Weekly Price Chart
EUR/USD Daily – Strategy for Next Week
That bullish support becomes a bit more clear on the daily chart as there’s an upward-sloping trendline taken from the low of 1.1002 from a few weeks ago.
The lower-high structure discussed on Thursday retains potential as there hasn’t been much for bullish drive above 1.1175, which is below the 1.1200 resistance which is inside of the 1.1212 level. Notably, all of this shows inside of last year’s high at 1.1275 so the case can still be argued that we remain within the 21-month range. And on the fundamental side of that argument, it’s not like there’s a host of strong economic data points out of the Eurozone that could substantiate an argument of hawkishness around the European Central Bank.
So, if we do see a USD bounce next week through the Q4 open or through the Non-farm Payrolls report, range continuation in EUR/USD remains a viable venue. But for USD-weakness, there may simply be greener pastures elsewhere, such as a pair that’s recently been able to show bullish drive through fresh yearly highs.
EUR/USD Daily Price Chart
Chart prepared by James Stanley, EUR/USD on Tradingview
--- written by James Stanley, Senior Strategist
Latest market news




The complete CFD trading experience
Award-winning platforms, competitive spreads, low commissions and dedicated support.
We live and breathe the markets and are dedicated to helping traders realise their ambitions as we continue to set the industry bar.
Economic calendar
Web Trader platform
Our sophisticated web-based platform is packed with features.
Related articles
EUR/USD weekly outlook: FOMC and ECB to set the tone
The current backdrop is modestly bearish. On Friday, the EUR/USD closed modestly lower, down for the third consecutive day. The pair also posted a weekly decline after staging a modest recovery attempt in the previous week. Out of the past 8 weeks, the EUR/USD has fallen on 6 occasions. There is not much supporting factors for the single currency right now. So, the upside remains capped.

Gold Does Something it Hasn’t Done in a Year, is Larger Risk-Off Afoot?
With tech stocks getting hit harder last week there was collateral damage elsewhere, including gold as the metal closed below the $4k level for the week and that’s the first time that’s happened to spot gold in more than a year.

US Dollar Price Action Setups: EUR/USD, USD/JPY, GBP/USD, USD/CAD
The Dollar is working on its second consecutive red week and while sellers didn’t exactly pounce on fresh lows, there’s an opening door for bears to make a move.
StoneX Europe Ltd may make third party material available on this website which may contain information included but not limited to the conditions of financial markets. The material is for information purposes only and does not contain, and should not be construed as containing, investment advice and/or investment recommendation and/or an investment research and/or an offer of or solicitation for any transactions in financial instruments; any decision to enter into a specific transaction shall be made by the client following an assessment by him/her of their situation.
StoneX Europe Ltd makes no representation or warranty and assumes no liability as to the accuracy or completeness of the information provided, nor any loss arising from any investment based on a recommendation, forecast or other information supplied. You should always seek independent advice as to your suitability to speculate in any related markets and your ability to assume the associated risks, if you are at all unsure. We are not under any obligation to update any such material. Any opinion made may be personal to the author and may not reflect the opinion of StoneX Europe Ltd.