



European Open: Triangle breakout in play on EUR/CAD
Prices broke out of a symmetrical triangle on Friday, a pattern which projects a target around 1.3550 if successful.
Share this:

Asian Indices:
- Australia's ASX 200 index fell by -15.9 points (-0.22%) and currently trades at 7,278.50
- Japan's Nikkei 225 index has risen by 274.13 points (0.8%) and currently trades at 34,754.93
- Hong Kong's Hang Seng index has fallen by -18.13 points (-0.08%) and currently trades at 21,394.27
- China's A50 Index has fallen by -42.19 points (-0.31%) and currently trades at 13,750.25
UK and Europe:
- UK's FTSE 100 futures are currently down -3 points (-0.04%), the cash market is currently estimated to open at 7,401.73
- Euro STOXX 50 futures are currently down -18 points (-0.47%), the cash market is currently estimated to open at 3,884.44
- Germany's DAX futures are currently down -60 points (-0.42%), the cash market is currently estimated to open at 14,353.09
US Futures:
- DJI futures are currently down -129 points (-0.37%)
- S&P 500 futures are currently down -59.5 points (-0.41%)
- Nasdaq 100 futures are currently down -14.75 points (-0.33%)
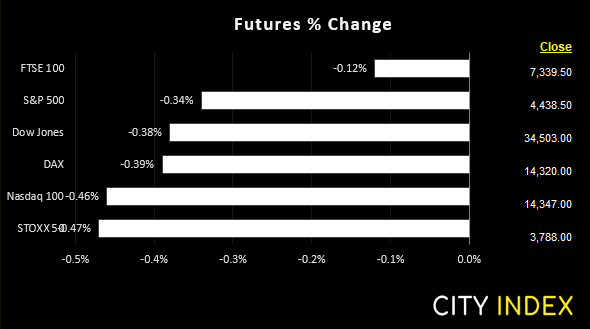
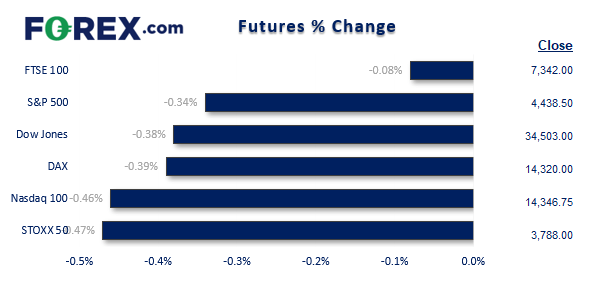
The strong rally on Wall Street heading into the weekend petered out during Asian trade today, with the majority of major benchmarks across the region trading lower for the day.
Ukraine rejected a deadline set by Russia for Mariupol to lay down their weapons and surrender. An ammonia leak from a chemical plant in Ukraine has affected a 2.5km area in the city of Sumy and a shopping centre in Kyiv has been shelled. Ukraine’s Deputy PM said there is “no question of surrender” and that Russia need to open a humanitarian corridor.
Gold prices were marginally higher across the board after receiving safe-haven flow, and platinum (a key export for Russia) rose back above 2500 on supply fears after Ukraine rejected Russia’s deadline. WTI also rose to a 5-day high on rising geopolitical tensions.
FTSE - Market Internals:
The FTSE 100 closed above 7400 for the first time in two weeks and back above the 50-day eMA on Friday. It was also its heaviest day of trading volume since March 2020, although this may be partly explained by the fact it was a triple witching day (where options, index and stock futures expire on the same day). The monthly pivot point is around 7450 and the 7500 high is within a day’s ATR, as long as prices rally from the open. However, the index has had a strong rally since the March low and with such resistance levels nearby we are also on guard for a reversal day or two.
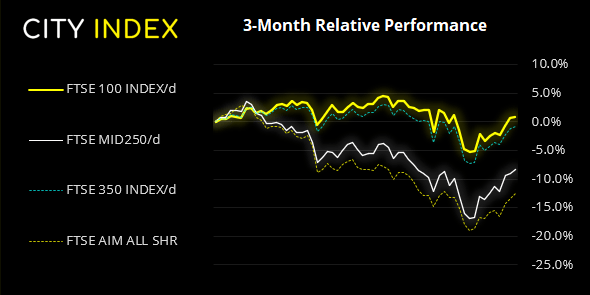
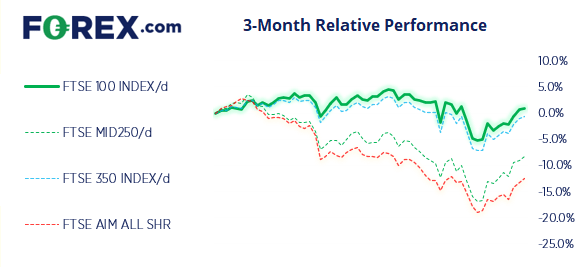
FTSE 350: 4164.9 (0.26%) 18 March 2022
- 249 (70.94%) stocks advanced and 91 (25.93%) declined
- 2 stocks rose to a new 52-week high, 1 fell to new lows
- 34.76% of stocks closed above their 200-day average
- 100% of stocks closed above their 50-day average
- 20.8% of stocks closed above their 20-day average
Outperformers:
- + 15.50% - Helios Towers PLC (HTWS.L)
- + 9.82% - Bridgepoint Group PLC (BPTB.L)
- + 7.60% - Ocado Group PLC (OCDO.L)
Underperformers:
- -4.18% - Sirius Real Estate Ltd (SRET.L)
- -3.90% - NCC Group PLC (NCCG.L)
- -3.68% - Centamin PLC (CEY.L)
Triangle breakout on EUR/CAD
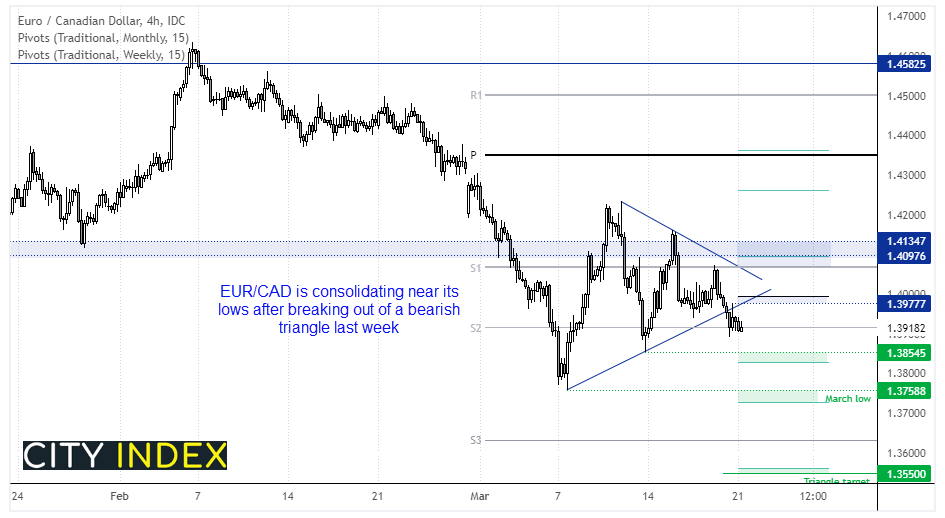
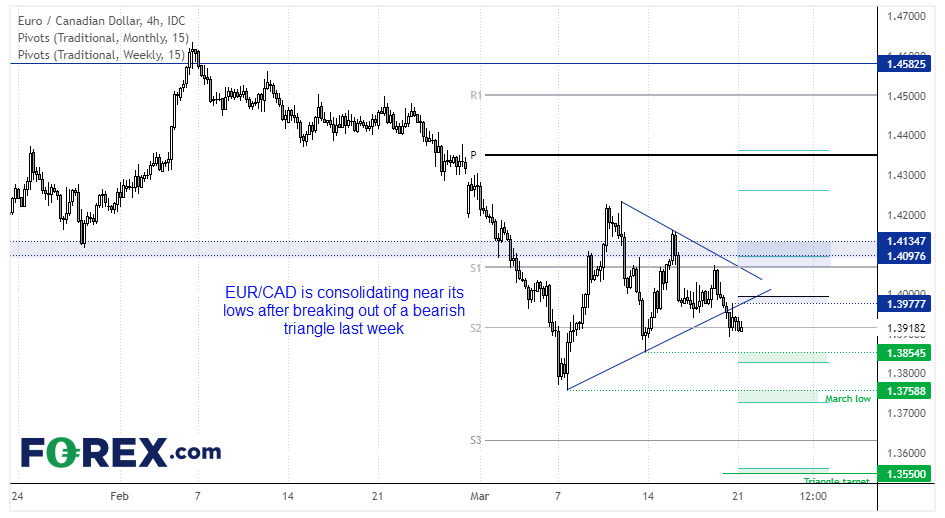
A strong retail print on boosted the Canadian dollar on Friday and helped EUR/CAD break to the downside of its symmetrical triangle. The pattern projects a target around 1.355, although support zones near the March low and 1.3855 low make suitable interim targets, depending on time horizon of the trader. Prices need to remain below the broken trendline to keep the triangle intact, and ideally any pullback against the breakout will remain below the 1.400 area, near the weekly pivot point.
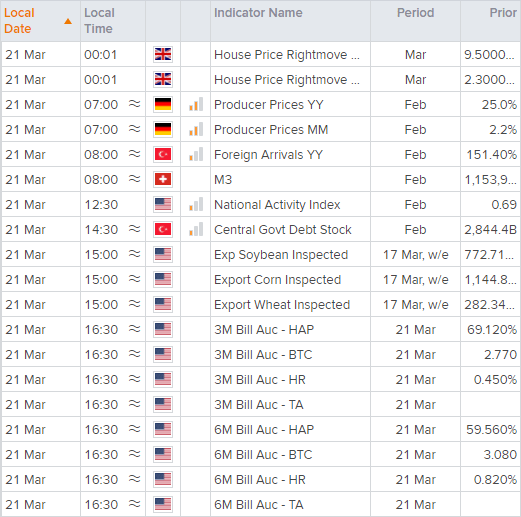
Up Next (Times in GMT)
How to trade with City Index
You can easily trade with City Index by using these four easy steps:
- Open an account, or log in if you’re already a customer
• Open an account in the UK
• Open an account in Australia
• Open an account in Singapore
- Search for the company you want to trade in our award-winning platform
- Choose your position and size, and your stop and limit levels
- Place the trade
How to trade with FOREX.com
Follow these easy steps to start trading with FOREX.com today:
- Open a Forex.com account, or log in if you’re already a customer.
- Search for the pair you want to trade in our award-winning platform.
- Choose your position and size, and your stop and limit levels.
- Place the trade.
Related tags:
Latest market news




The complete CFD trading experience
Award-winning platforms, competitive spreads, low commissions and dedicated support.
We live and breathe the markets and are dedicated to helping traders realise their ambitions as we continue to set the industry bar.
Economic calendar
Web Trader platform
Our sophisticated web-based platform is packed with features.
Related articles
EUR/USD weekly outlook: FOMC and ECB to set the tone
The current backdrop is modestly bearish. On Friday, the EUR/USD closed modestly lower, down for the third consecutive day. The pair also posted a weekly decline after staging a modest recovery attempt in the previous week. Out of the past 8 weeks, the EUR/USD has fallen on 6 occasions. There is not much supporting factors for the single currency right now. So, the upside remains capped.

USD/JPY Forecast: Is Rising Japanese Inflation Supporting the Yen?
As the trading week comes to an end, one of the most relevant developments in the FX market has been the renewed strength of the Japanese yen. This can be seen in the recent performance of USD/JPY, which has fallen nearly 1.0% over the last two trading sessions, highlighting a meaningful recovery in the Japanese currency against the U.S. dollar.


Silver forecast: metals liquidation drags XAG/USD into $50-55 support
Silver has broken its July low and slipped into a long-term support zone as the selling in precious metals deepens. The chart shows where the metal could bottom, and next week's Fed decision may decide whether it does.
StoneX Europe Ltd may make third party material available on this website which may contain information included but not limited to the conditions of financial markets. The material is for information purposes only and does not contain, and should not be construed as containing, investment advice and/or investment recommendation and/or an investment research and/or an offer of or solicitation for any transactions in financial instruments; any decision to enter into a specific transaction shall be made by the client following an assessment by him/her of their situation.
StoneX Europe Ltd makes no representation or warranty and assumes no liability as to the accuracy or completeness of the information provided, nor any loss arising from any investment based on a recommendation, forecast or other information supplied. You should always seek independent advice as to your suitability to speculate in any related markets and your ability to assume the associated risks, if you are at all unsure. We are not under any obligation to update any such material. Any opinion made may be personal to the author and may not reflect the opinion of StoneX Europe Ltd.