





EUR/USD Halts Three-Day Selloff to Keep RSI Out of Oversold Territory
EUR/USD halts a three-day selloff to keep the Relative Strength Index (RSI) out of oversold territory.
Share this:

US Dollar Outlook: EUR/USD
EUR/USD halts a three-day selloff to keep the Relative Strength Index (RSI) out of oversold territory, but a move below 30 in the oscillator is likely to be accompanied by a further decline in the exchange rate like the price action from last year.
EUR/USD Halts Three-Day Selloff to Keep RSI Out of Oversold Territory
Keep in mind, EUR/USD failed to defend the November low (1.0333) as it struggled to retrace the weakness following the US election, and the exchange rate may continue to track the negative slope in the 50-Day SMA (1.0569) as it holds below the moving average.
Join David Song for the Weekly Fundamental Market Outlook webinar.
David provides a market overview and takes questions in real-time. Register Here
In turn, the rebound in EUR/USD may turn out to be temporary, but the exchange rate may consolidate during the first full week of January amid the limited reaction to the US ISM Manufacturing survey, which showed the index widening to 49.3 in December from 48.4 the month prior.
With that said, the opening range for 2025 is in focus for EUR/USD as it no longer carves a series of lower highs and lows, but the RSI may show the bearish momentum gathering pace if it falls below 30 and pushes into oversold territory.
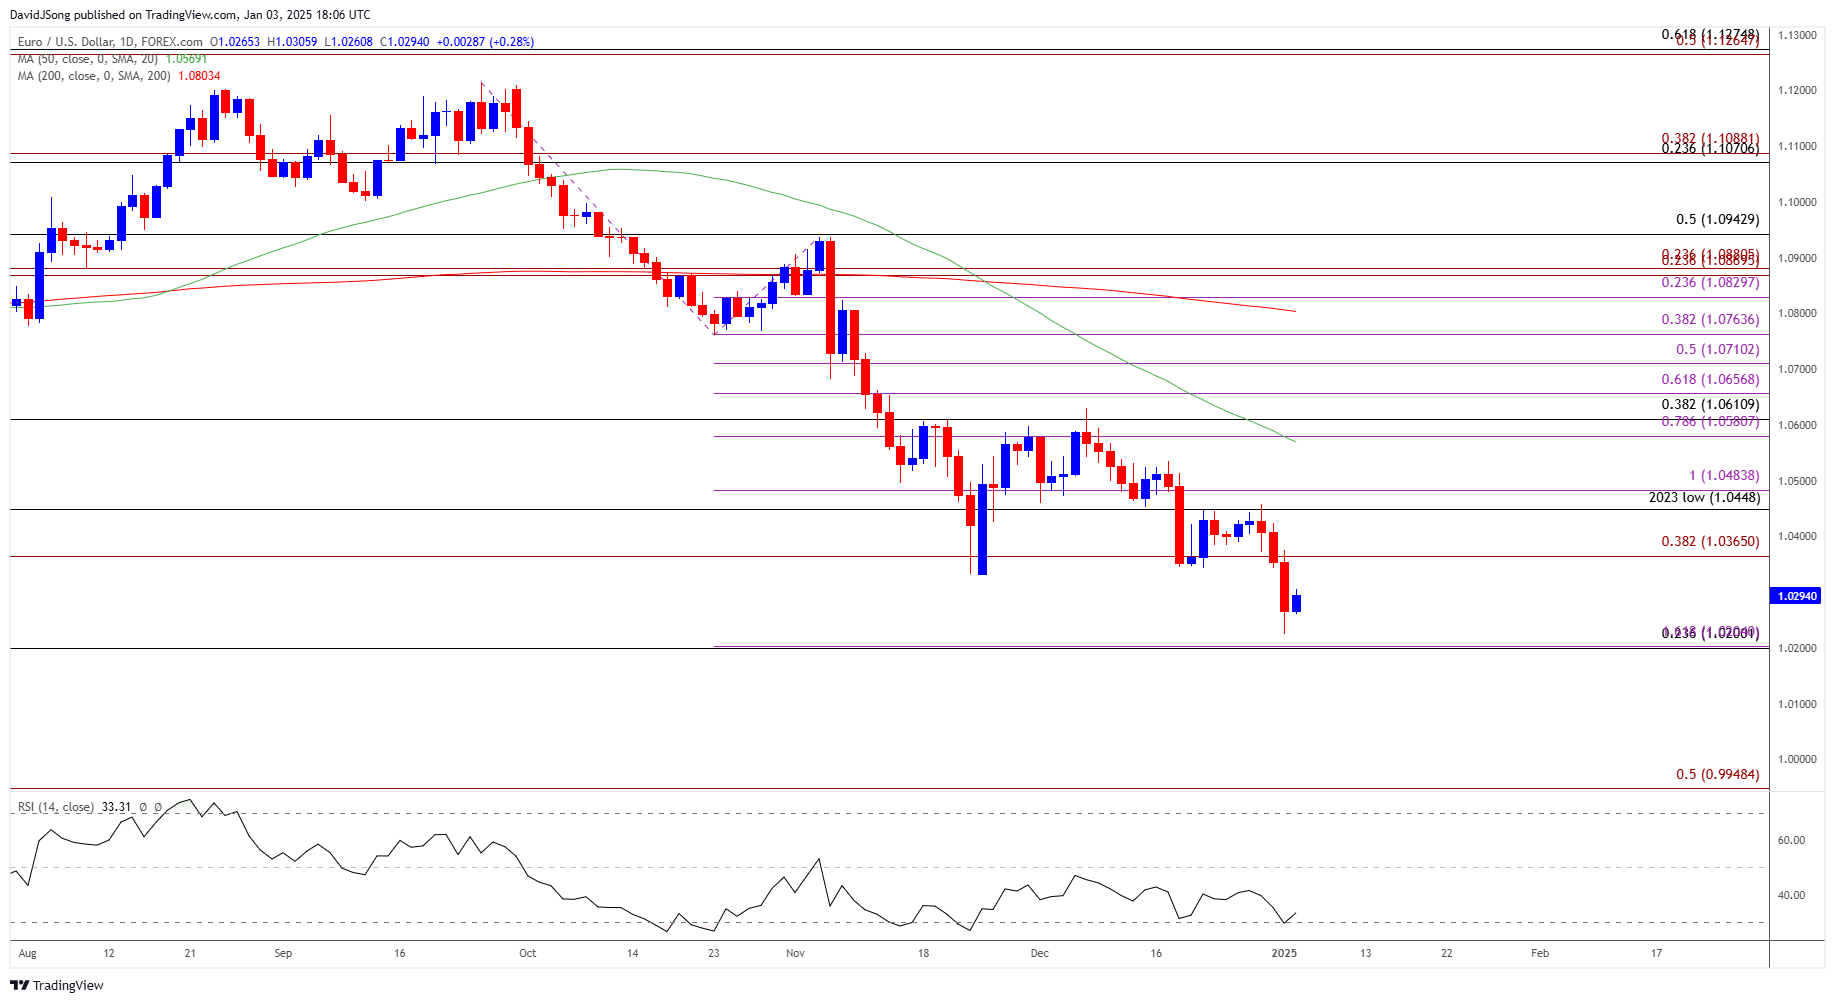
EUR/USD Chart – Daily
Chart Prepared by David Song, Senior Strategist; EUR/USD on TradingView
- EUR/USD bounces back ahead of 1.0200 (23.6% Fibonacci retracement) to keep the Relative Strength Index (RSI) above 30, with a move back above 1.0370 (38.2% Fibonacci extension) bringing the 1.0448 (2023 low) to 1.0480 (100% Fibonacci extension) zone back on the radar.
- Next area of interest comes in around 1.0580 (78.6% Fibonacci extension) to 1.0610 (38.2% Fibonacci retracement), but EUR/USD may struggle to retain the rebound from the weekly low (1.0224) as it appears to be tracking the negative slope in the 50-Day SMA (1.0569).
- Failure to hold above 1.0200 (23.6% Fibonacci retracement) may push EUR/USD towards parity, with the next area of interest coming in around 0.9950 (50% Fibonacci extension).
Additional Market Outlooks
USD/CAD Rebound Pushes RSI Back Towards Overbought Zone
British Pound Forecast: GBP/USD Pushes Below May Low to Eye 2024 Low
AUD/USD Vulnerable to Change in RBA Policy
US Economy Proves Stronger-Than-Expected in 2024
--- Written by David Song, Senior Strategist
Follow on Twitter at @DavidJSong
Related tags:




The complete CFD trading experience
Award-winning platforms, competitive spreads, low commissions and dedicated support.
We live and breathe the markets and are dedicated to helping traders realise their ambitions as we continue to set the industry bar.
Economic calendar
Web Trader platform
Our sophisticated web-based platform is packed with features.
Related articles
USD/CAD shooting star puts September surge on notice
USD/CAD has printed a clear bearish reversal pattern after an extraordinary September surge, but confirmation may depend heavily on how US Treasury yields react to Friday’s payrolls report.

US Dollar Technical Outlook: DXY Bulls Meet Resistance at Yearly Highs 10 1 2026
The U.S. Dollar has held firm despite fading Fed hike bets, but Friday’s payrolls could test the rally’s staying power.


EUR/USD, GBP/USD Outlook: RSI Hits 2020 Oversold Levels
EUR/USD, GBP/USD Outlook: The EUR/USD daily RSI has fallen to oversold levels last seen in 2020, raising the risk of a reversal across correlated currency pairs, including the US dollar and GBP/USD.

StoneX Europe Ltd may make third party material available on this website which may contain information included but not limited to the conditions of financial markets. The material is for information purposes only and does not contain, and should not be construed as containing, investment advice and/or investment recommendation and/or an investment research and/or an offer of or solicitation for any transactions in financial instruments; any decision to enter into a specific transaction shall be made by the client following an assessment by him/her of their situation.
StoneX Europe Ltd makes no representation or warranty and assumes no liability as to the accuracy or completeness of the information provided, nor any loss arising from any investment based on a recommendation, forecast or other information supplied. You should always seek independent advice as to your suitability to speculate in any related markets and your ability to assume the associated risks, if you are at all unsure. We are not under any obligation to update any such material. Any opinion made may be personal to the author and may not reflect the opinion of StoneX Europe Ltd.