




Global Selloff Deepens as April 2 Tariffs Loom
Global markets tumble as Trump’s “Liberation Day” auto tariffs trigger a sharp selloff ahead of the April 2 implementation. DAX closes below 50 EMA, signaling deeper downside toward 21,700–20,400, while $20B evaporates from Japan’s auto sector. Gold hits $3,100 amid safe-haven rush, and crypto slumps on policy fears.
Share this:

Market Summary – 31 March 2025
Global Markets Rattle Amid 'Liberation Day' Tariff Shock
- Asian markets plunged, led by Japan’s Nikkei falling -3.8%, its worst drop in six months, with all 33 Tokyo sectors in the red.
- South Korean stocks also declined sharply, following Trump's confirmation of sweeping 25% global auto tariffs, starting April 2.
- The plan, dubbed “Liberation Day”, aims to level perceived tariff imbalances and targets all trading partners, escalating fears of a global trade war.
- European markets followed suit:
- DAX -1.08%, CAC 40 -0.97%, FTSE 100 -0.79%.
- Wall Street auto stocks, including GM and Ford, came under pressure, though Tesla remained resilient due to its domestic production base.
DAX Technical Analysis 1 Day
The Germany 40 (DAX) daily chart confirms a bearish breakdown, as price closed at 22,235.7, below the 50 EMA (22,256.8) and the previous consolidation support. The -1.00% drop reflects increased downside pressure and a clear loss of bullish momentum.
Key Technical Signals:
- Price action: This is the first clean break below the 50 EMA since October 2023, which is a significant shift in market tone.
- RSI at 42: Momentum is now tilted bearish, with room to move lower before becoming oversold.
- Stochastic RSI: Deeply oversold (0.00/4.73), indicating the potential for a short-term bounce, but not a reversal signal on its own.
Next Key Support Levels:
- 21,750–21,700: The zone between the recent lows and the 100 EMA (21,426.6) — possible first target.
- 20,474: Major horizontal level from previous structure (December/January) and psychological round number.
- 20,308.1: 200 EMA – the long-term trend support.
Resistance to Watch:
- 22,500–22,600: Now-turned-resistance from the 50 EMA zone.
- 22,850–23,000: Breakdown point from previous rising wedge pattern.
Summary:
The breakdown beneath the 50 EMA, alongside bearish momentum and trend structure, tilts the bias to the downside. A relief bounce is possible due to oversold Stochastic RSI, but unless price can reclaim 22,600+, sellers are likely to remain in control. A continuation toward the 100 EMA and even 20,400 looks increasingly probable if the current momentum persists as the RSI has not reached oversold levels just yet..
Tariff Breakdown – April 2 Onward
| Country/Region | Tariff Details |
| Canada |
|
| Mexico |
|
| China |
|
| European Union |
|
| All Countries (Global) |
|
| Russia |
|
| Other Countries |
|
- Goldman Sachs raised U.S. recession odds to 35% (from 20%), citing tariff impacts.
Bond & Currency Markets
- Bond yields fell as risk sentiment deteriorated.
- Dollar weakened, especially against the yen, as the U.S.’s own policy risks undermine safe-haven status.
Commodity Watch
- Gold surged to fresh record highs above $3,100, up 17% this quarter, on escalating trade and geopolitical fears.
- Oil prices held steady, unaffected by broader equity sell-offs.
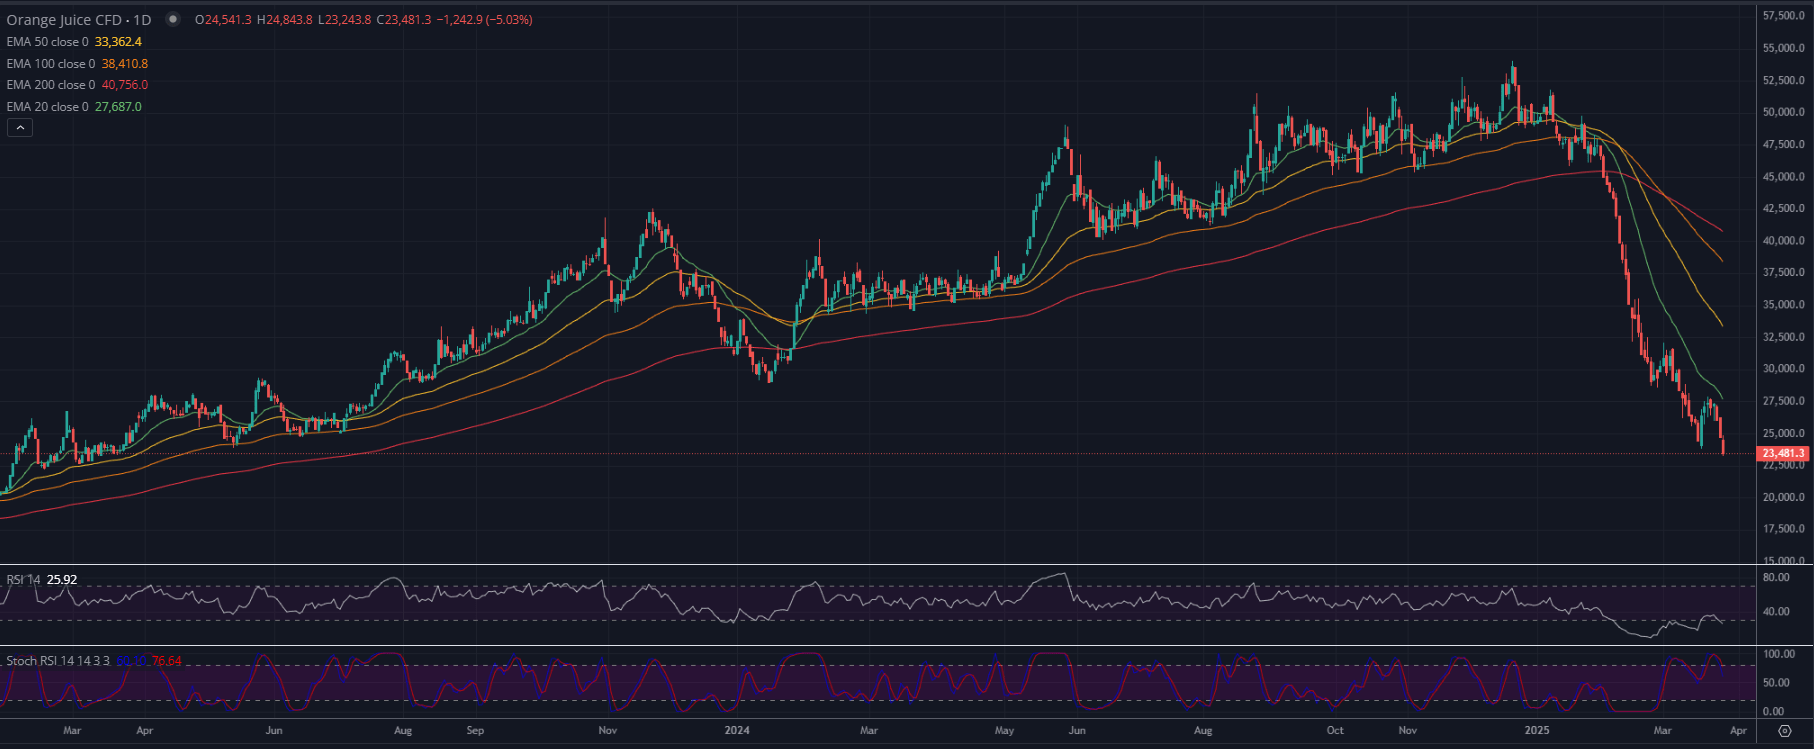
Orange Juice Collapse
- OJ futures have plunged ~54% YTD, now at 247 USX, down from a Dec high of 539 USX.
- Drivers of collapse:
- Consumer demand dropped 16% due to high prices and bitter taste from disease-affected crops.
- Brazil’s orange crop to rise 20% (Rabobank), triggering speculator exit.
- Despite the drop, prices still 150% above 2020 levels.
Crypto Market Update
- Crypto under pressure amid tariff uncertainty:
- Bitcoin -1% to $82,045, low at $81,300.
- Ether -1.5% to $1,809.93, down 19.2% in March, hitting 16-month low.
- XRP -3.5% to $2.10, erasing gains after SEC dropped Ripple case.
- Cardano -3.4%, Dogecoin -2.7%, Solana flat, $TRUMP -1.1%, near record lows.
Outlook
- April 2 marks a pivotal inflection point with full implementation of Trump’s global tariff plan.
- Equities, autos, and export-reliant sectors are under heavy pressure, while gold and safe-havens remain bid.
- Recession risks are climbing, and central bank rate cut expectations are rising across the Fed, ECB, and BOE.
- Investors await potential retaliation from key U.S. trade partners, and updates on potential tariff exemptions or negotiation channels, particularly with China.
Related tags:
Latest market news




The complete CFD trading experience
Award-winning platforms, competitive spreads, low commissions and dedicated support.
We live and breathe the markets and are dedicated to helping traders realise their ambitions as we continue to set the industry bar.
Economic calendar
Web Trader platform
Our sophisticated web-based platform is packed with features.
Related articles

Dow Jones forecast: Stock markets under pressure from multiple sources
When looking at the major tech-heavy US indices like the S&P 500 or the Nasdaq 100, you wouldn’t think that the stock market is particularly weak. Yet, beneath the surface, the market is far from healthy right now. Investors are evidently just piling into the big tech and AI names, and as a result, market breadth is deteriorating. Other indices like the small cap Russell 2000 and the Dow Jones are starting to reflect that weakness.


Nikkei breakout accelerates as yen weakness returns
Nikkei has started October with a powerful breakout, helped by renewed yen weakness and strong upside momentum


S&P 500 Forecast: SPX Continues to Drift Away from Record Highs
Recent trading sessions have done little to restore confidence in the equity market. Over the last four sessions, the S&P 500 has declined by nearly 1.00%, a move that highlights growing short-term weakness and keeps the index moving further away from its record-high territory.
StoneX Europe Ltd may make third party material available on this website which may contain information included but not limited to the conditions of financial markets. The material is for information purposes only and does not contain, and should not be construed as containing, investment advice and/or investment recommendation and/or an investment research and/or an offer of or solicitation for any transactions in financial instruments; any decision to enter into a specific transaction shall be made by the client following an assessment by him/her of their situation.
StoneX Europe Ltd makes no representation or warranty and assumes no liability as to the accuracy or completeness of the information provided, nor any loss arising from any investment based on a recommendation, forecast or other information supplied. You should always seek independent advice as to your suitability to speculate in any related markets and your ability to assume the associated risks, if you are at all unsure. We are not under any obligation to update any such material. Any opinion made may be personal to the author and may not reflect the opinion of StoneX Europe Ltd.