



Gold outlook: Technical Tuesday July 27, 2025
In this version of Technical Tuesday, we will look at the daily and monthly charts to highlight some key short-term levels as well as some long-term technical factors impacting the gold outlook. But with the metal slightly firmer on the day, some traders are also wondering why the metal has remained relatively stable despite EU-US trade agreement and the big stock market gains we have seen.
Share this:

In this version of Technical Tuesday, we will look at the daily and monthly charts to highlight some key short-term levels as well as some long-term technical factors impacting the gold outlook. But with the metal slightly firmer on the day, some traders are also wondering why the metal has remained relatively stable despite EU-US trade agreement and the big stock market gains we have seen. Let’s tackle that question first before turning our focus to the charts and technical analysis.
Why is gold relatively stable despite EU-US trade agreement?
Gold’s resilience in the face of a stable equity market following the EU-US trade agreement suggests some investors still feel that the broad-based tariffs deal would be more of a burden than a boon for the European Union, even if it means an imminent trade war with the US has been averted for now. Critics argue that the deal is bad for the EU and will cause inflation to rise in the US, requiring tighter monetary policy than would otherwise be the case. That said, it is difficult to say precisely to what extent has the US–EU trade deal reduced safe-haven demand for gold, if it has at all. And then there is the ongoing US-China trade talks. Officials from Beijing and Washington are trying to extend their tariff truce beyond a mid-August deadline, in an effort to find ways to maintain trade ties. Given the risk of a breakdown in talks, some investors still feel that it may be appropriate to have some exposure to haven assets in case things turn sour again.
Short-term technical gold outlook: Daily Chart
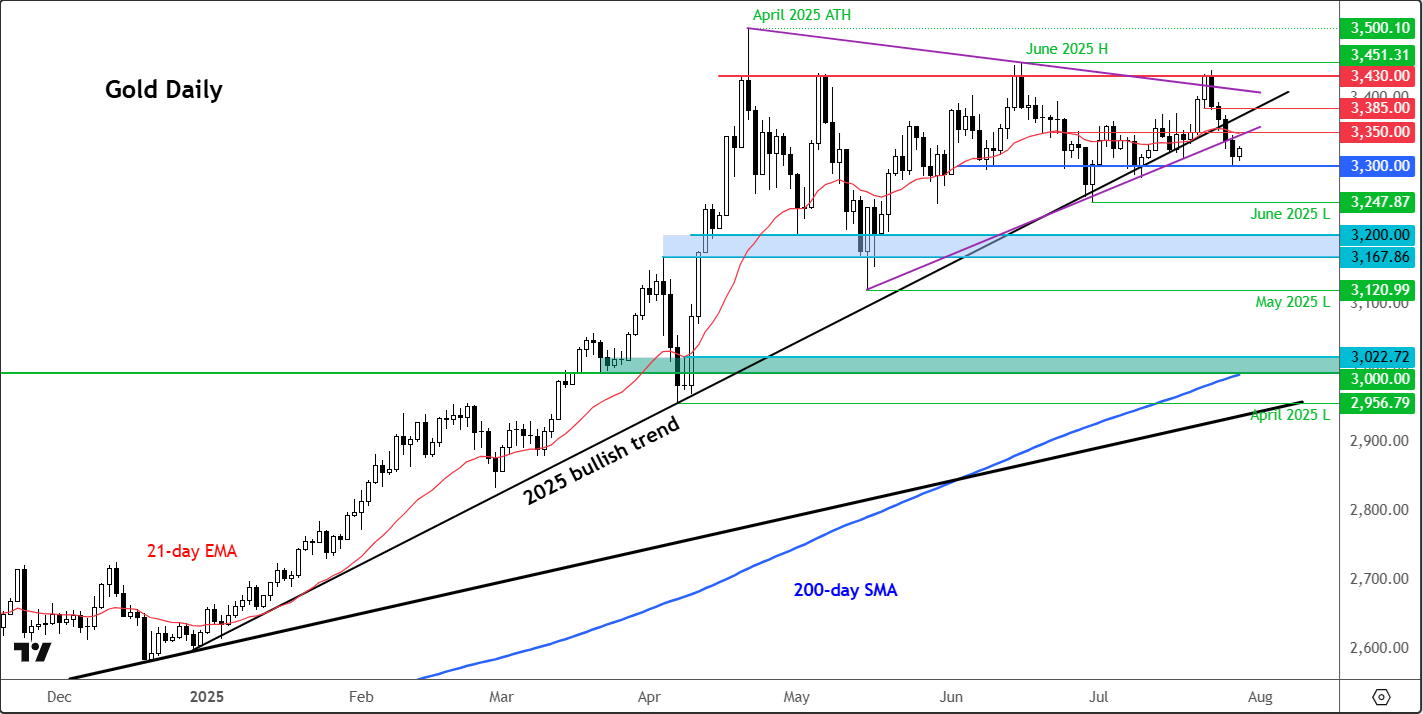
Gold has eroded its 2025 bullish trendline, situated in the $3,330–$3,350 region. This means the technical gold outlook has turned mildly bearish, though more support levels need to break to increase the strength of the bears’ control.
From a bullish point of view, the price of gold now needs to move decisively back above the broken trend line to trigger the start of another bullish wave. But the longer it holds below this $3,330–$3,350 zone, the more it will increase the risk of a short-term correction – especially if immediate support at $3,300 gives way soon. Below that, the June low of $3,247 emerges as the next key marker.
On the upside, resistance is layered at $3,350, $3,385, and $3,430.
Longer-term gold outlook: XAU/USD on track to form 3rd monthly doji
The monthly chart of gold continues to show indecisive price action at these lofty levels. After forming two doji candles in the previous couple of months, it looks like a hattrick is on for July. A doji candle is one with a small body and long wicks on one or both sides. This shows that neither the bulls nor the bears are in full control. It makes sense given that BIG rally over the past several quarters to repeated all-time highs.
The existing bullish trend looks to be getting fatigued and the long-term oscillators are still flash big warning signs. The monthly RSI for example has remained above the ‘overbought’ threshold of 70 since April 2024, reaching extreme levels this summer of above 85.00. Such RSI levels have invariably led to a period of consolidation or a pullback in the past. Are we about to witness another such an outcome?
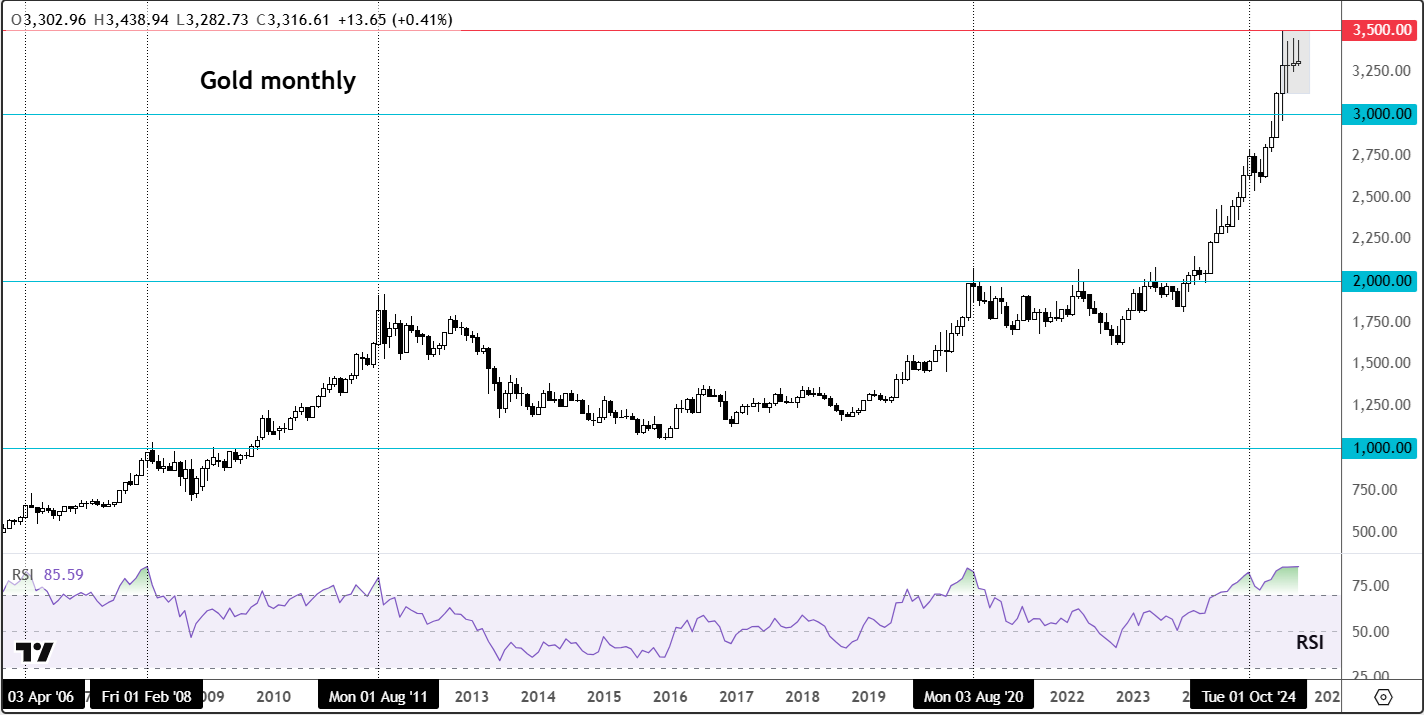
The bulls would like to see continued consolidation at these levels which, through time, should allow the RSI to unwind from overbought levels. The bears, as well the bulls who missed out on the big rally, will want the RSI to unwind through price action via a sizeable correction.
Ultimately, the long-term chart of gold still looks quite bullish, and we haven’t had any major reversal signs to point to. The doji candles by themselves and the extreme RSI levels are merely a warning sign of exhaustion.
What about the rest of 2025?
Gold’s extraordinary rally and the parabolic-like moves in recent quarters would always come to an eventual pause, which has been the case in the last few months. After the initial rally to a record $3,500 in April, gold has been busy digesting those gains since. As we transition to August and the second half of 2025, gold’s long-term uptrend may be tested, or at least the pace of future gains is likely to slow down. With prices deeply overbought on the long-term charts, continued consolidation now appears both healthy and necessary. Even a correction should not come as surprise given the big return of risk appetite with the benchmark US and European indices recovering all their losses triggered in April, before hitting new record highs. The increased risk appetite should mean lower haven demand, while the dollar’s slight recovery, if sustained, could also weigh on the gold outlook.
👉 Read our full H2 2025 Gold outlook here.
Source for all charts used in this article: TradingView.com
-- Written by Fawad Razaqzada, Market Analyst
Follow Fawad on Twitter @Trader_F_R


The complete CFD trading experience
Award-winning platforms, competitive spreads, low commissions and dedicated support.
We live and breathe the markets and are dedicated to helping traders realise their ambitions as we continue to set the industry bar.
Economic calendar
Web Trader platform
Our sophisticated web-based platform is packed with features.
Related articles
USD/JPY weekly outlook: Quarter turn scrambles rates regime
USD/JPY’s tight relationship with front-end US rates broke down sharply last week, but quarter-turn flows and positioning suggest the disconnect may prove temporary.

Gold Update: XAU/USD Remains Under Pressure Even After the NFP Report
As the trading week comes to an end, weakness around gold price action remains evident in the short term. This can be seen in the performance of the past two sessions, where the metal has declined by approximately 0.3%. Although the move has not been particularly aggressive, it highlights that buying pressure continues to struggle to regain control of the market.


USD/CAD forecast: rally could accelerate above June highs at 1.4250
USD/CAD recovered quickly after weaker US jobs data, keeping the bullish trend in focus. A move above the June highs could accelerate the rally as inflation keeps the Fed under pressure.
StoneX Europe Ltd may make third party material available on this website which may contain information included but not limited to the conditions of financial markets. The material is for information purposes only and does not contain, and should not be construed as containing, investment advice and/or investment recommendation and/or an investment research and/or an offer of or solicitation for any transactions in financial instruments; any decision to enter into a specific transaction shall be made by the client following an assessment by him/her of their situation.
StoneX Europe Ltd makes no representation or warranty and assumes no liability as to the accuracy or completeness of the information provided, nor any loss arising from any investment based on a recommendation, forecast or other information supplied. You should always seek independent advice as to your suitability to speculate in any related markets and your ability to assume the associated risks, if you are at all unsure. We are not under any obligation to update any such material. Any opinion made may be personal to the author and may not reflect the opinion of StoneX Europe Ltd.