




Gold Price Forecast: Gold Builds Bull Pennant into Jackson Hole
Gold’s had a big run from last year’s lows but most recently it’s been stalled. The big question now is whether bulls can continue the move following four months of digestion.
Share this:

Gold Talking Points:
- Gold’s rally has spanned more than 76% from the 2024 low to the 2025 high.
- More recently, the bullish trend in gold has been stalled following the test at $3500 back in April. But – bulls haven’t exactly given up as we’ve seen a build of higher-lows and a more recent show of resistance at $3435/oz.
- The last time we saw stall of this nature was around the election last year, when gold prices stalled inside of the 2800 level and then spent two months digesting before ultimately breaking out to the upside again. That prior instance was a bull pennant that led into a strong rally through Q1, 2025 trade.
Gold prices have now been stalled for almost four months exactly after spot gold found resistance at the $3500 level on Easter Monday. That put the 14-month rally at a whopping 76% from the 2024 lows, which saw only two daily closes below the $2k psychological level. Normally a run of that nature would lead into more profit taking but so far, there’s only been limited pullbacks, with a brief test below the 23.6% retracement of the 2024-2025 rally.
Interestingly, the stalling shown since the $3500 test in April has taken on the form of a symmetrical triangle, which resembles another symmetrical triangle that showed after the 40% rally from the February 2024 low up to the October 2024 high. At that point, gold digested the rally with symmetrical triangle that built a bull pennant formation.
Gold Weekly Chart
Chart prepared by James Stanley; data derived from Tradingview
Gold Drivers
Last year saw just two days with gold closing below the $2k psychological level, and the drivers around that event were informative as it happened after a strong CPI print that brought question to FOMC rate cut expectations. But, shortly after the data was released Chicago Fed President Austan Goolsbee implored markets to not get ‘flipped out’ about a single inflation print, and that’s when gold went on to rally in a near-historic fashion, all the way until that October high when the symmetrical triangle had formed.
In the latter portion of last year we saw both Treasury yields and the US Dollar run-higher and that was a contributing factor to the pullback in gold. But as we came into 2025 and after President Trump was inaugurated, USD-weakness took back over and that helped to propel gold back up to fresh all-time-highs.
So far this year, however, inflation data hasn’t exactly made the Fed’s case for rate cuts a simple one. And this puts more emphasis on the upcoming Jackson Hole Economic Symposium as any pushes towards rate cuts could potentially help gold bulls to make another run at 3435, or perhaps even the 3500 level that lurks above that.
Gold Daily Chart
Chart prepared by James Stanley; data derived from Tradingview
Gold Shorter-Term, Levels of Note
For the past week and change gold prices have been pulling back from another failed run at the $3400 level. This could be driven by profit-taking ahead of the Symposium, along with the caution around whether Jerome Powell will open the door to a September cut, a door which he had seemingly closed at the FOMC rate decision in July.
But, so far, we’ve had a hold of support at prior resistance in gold from the 3314 level, and that’s so far led to a bounce up to the 3350 level which has been a key price in gold over the past four months. The recent digestion has led to the build of a falling wedge, and that’s given way to breakout so far today.
I remain biased as bullish in gold and if we do see USD-weakness as a result of this week’s Jackson Hole outing, I think gold remains one of the more attractive markets to work with. If we do see USD-strength, the big question following that is whether higher-low supports hold as bulls come in as response to the sell-off, similar to what’s shown on a smaller scale so far this morning.
Gold Four-Hour Price Chart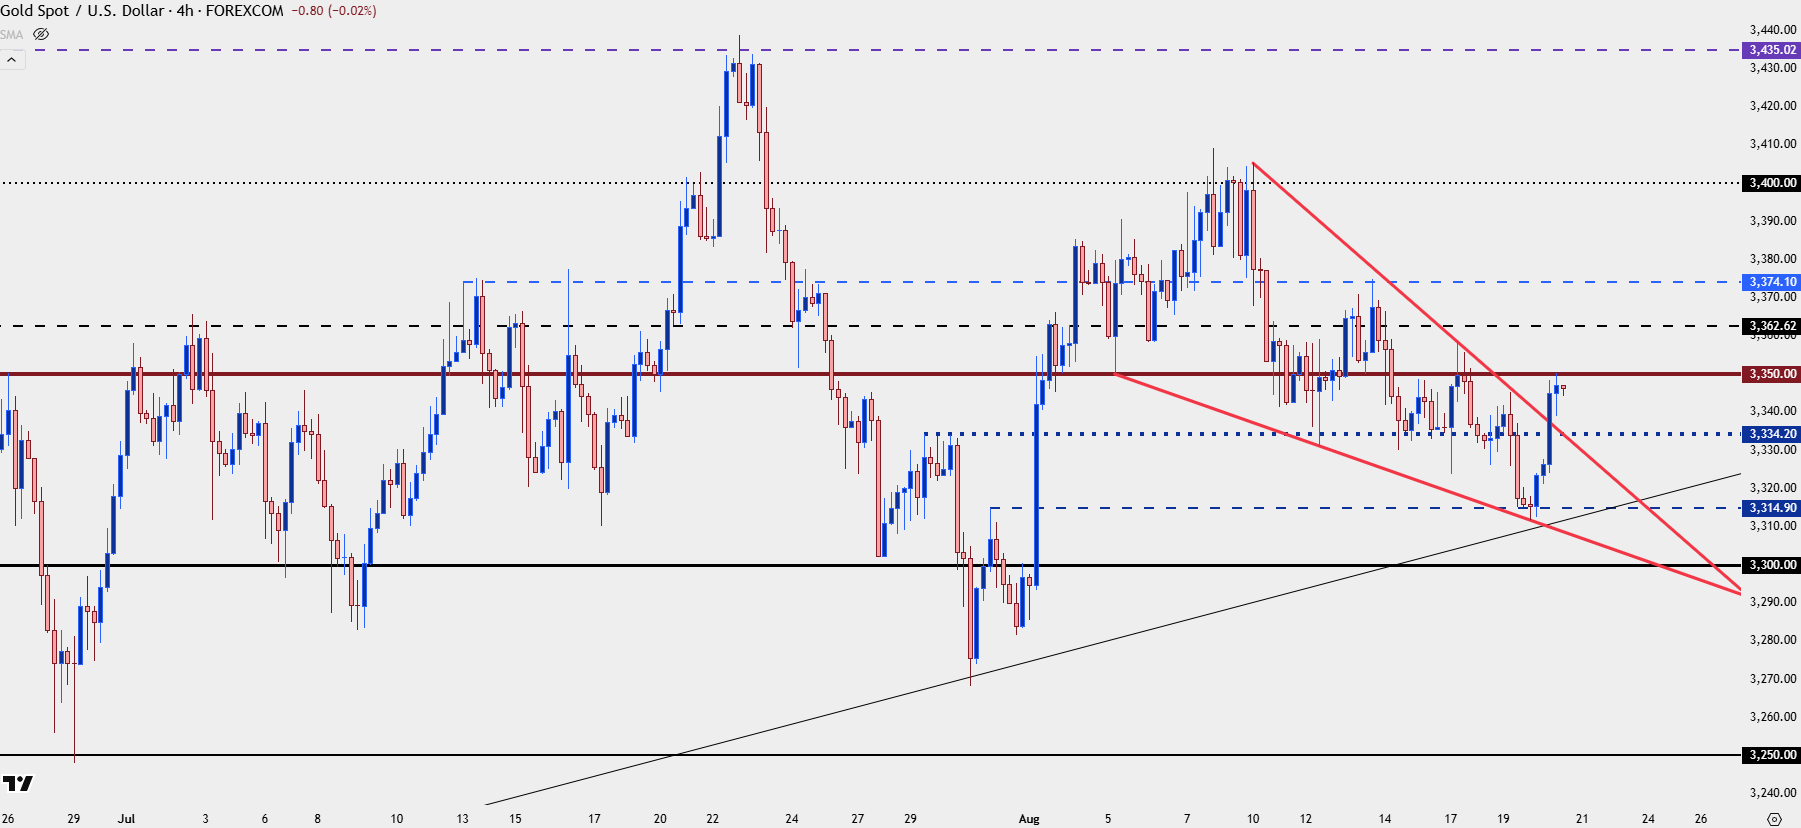
Chart prepared by James Stanley; data derived from Tradingview
--- written by James Stanley, Senior Strategist
Related tags:
Latest market news



The complete CFD trading experience
Award-winning platforms, competitive spreads, low commissions and dedicated support.
We live and breathe the markets and are dedicated to helping traders realise their ambitions as we continue to set the industry bar.
Economic calendar
Web Trader platform
Our sophisticated web-based platform is packed with features.
Related articles
Gold Analysis: XAU/USD Holds Above Key Support Ahead of the Fed Decision
Over the last few trading sessions, gold has managed to stage a modest recovery. The precious metal has gained more than 1.7% across the last two sessions, a move that has introduced some buying momentum after several weeks of sustained pressure on prices. For now, this rebound appears to be driven largely by the cautious atmosphere dominating markets ahead of the Federal Reserve's monetary policy decision.
Pre-FOMC US Dollar Price Action Setups: EUR/USD, USD/JPY, GBP/USD, USD/CAD
Tomorrow brings the Fed and then mid-term elections next week and CPI the week after, so we have a loaded few weeks ahead as USD strength remains in-play.
Silver Forecast: Is XAG/USD Finally Finding a Bottom
Silver is showing some encouraging signs after an initially weak start to the session. The metal dropped to a new year-to-date low below the $53 handle, reaching $52.60 before staging a sharp recovery.

StoneX Europe Ltd may make third party material available on this website which may contain information included but not limited to the conditions of financial markets. The material is for information purposes only and does not contain, and should not be construed as containing, investment advice and/or investment recommendation and/or an investment research and/or an offer of or solicitation for any transactions in financial instruments; any decision to enter into a specific transaction shall be made by the client following an assessment by him/her of their situation.
StoneX Europe Ltd makes no representation or warranty and assumes no liability as to the accuracy or completeness of the information provided, nor any loss arising from any investment based on a recommendation, forecast or other information supplied. You should always seek independent advice as to your suitability to speculate in any related markets and your ability to assume the associated risks, if you are at all unsure. We are not under any obligation to update any such material. Any opinion made may be personal to the author and may not reflect the opinion of StoneX Europe Ltd.