



Gold, Swiss franc battling headwinds from higher US dollar, interest rates
US interest rate expectations are heavily influencing gold and USD/CHF movements yet again, putting increased emphasis on incoming inflation and labour market data, along with gyrations in short-term debt securities, to dictate direction. Recent trends look similar to what was seen in the March quarter this year, pointing to the risk of further US dollar strengthening ahead.
Share this:

- USD/CHF and gold revert to US interest rate proxies over past fortnight
- As US inflation expectations pickup, Fed rate cut bets dwindle
- US CPI released Thursday, core reading expected to lift 0.2% MM, 3.2% YY
- USD/CHF grinding higher within uptrend
- Gold down but not out as uptrends remain intact
Overview
US interest rate expectations are heavily influencing gold and USD/CHF movements again, putting increased emphasis on incoming inflation and labour market data, along with gyrations in short-term debt securities, to dictate direction. Recent trends look similar to what was seen in the March quarter this year, pointing to the risk of further US dollar strengthening ahead.
US rates heavily influence gold, USD/CHF moves
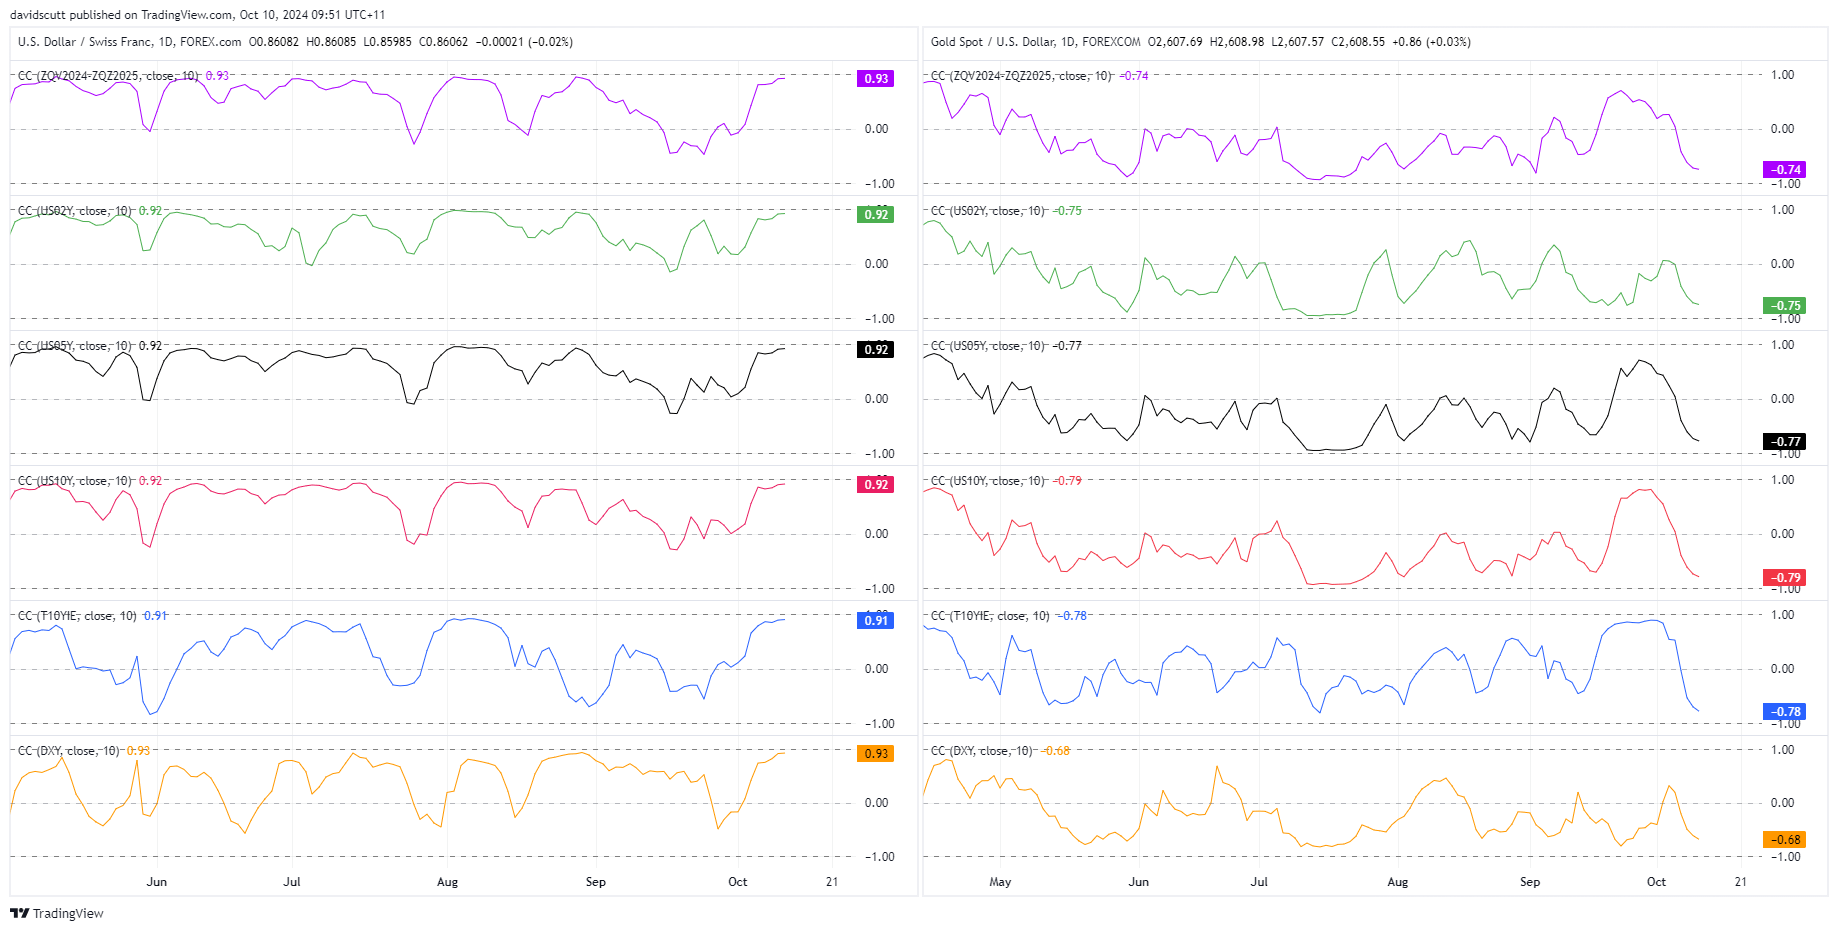
After disconnecting briefly around the turn of the quarter, US interest rate markets once again have a stranglehold on movements in USD/CHF and gold. You can see than in the correlation analysis below looking at the rolling 10-day relationship between both markets with a variety of interest rate and FX variables. USD/CHF is shown on the left, gold on the right.
From top to bottom, we have Fed rate cut expectations out to the end of 2025 in purple, US two-year yields in green, US five-year yields in black, US 10-year yields in red, US 10-year inflation expectations in blue and the US dollar index in yellow.
As a reminder, correlation coefficient scores measure the relationship between two variables over a set timeframe, ranging from a score of +1 to -1. A score of +1 indicates both move in lockstep with one another, while a score of -1 signals they always move in the opposite direction to the other. The closer the score to either +1 or -1, the stronger the relationship or inverse relationship between the two.
Looking at the scores above, USD/CHF has been strongly correlated with movements in US interest rates over the past fortnight, be it short or longer-term. While not to the same strength as USD/CHF, the scores for gold indicate it’s typically moved in the opposite direction to US interest rates over the same period.
One way or another, US rates are back in the driving seat.
Fed rate cut bets dwindle as inflation expectations heat up
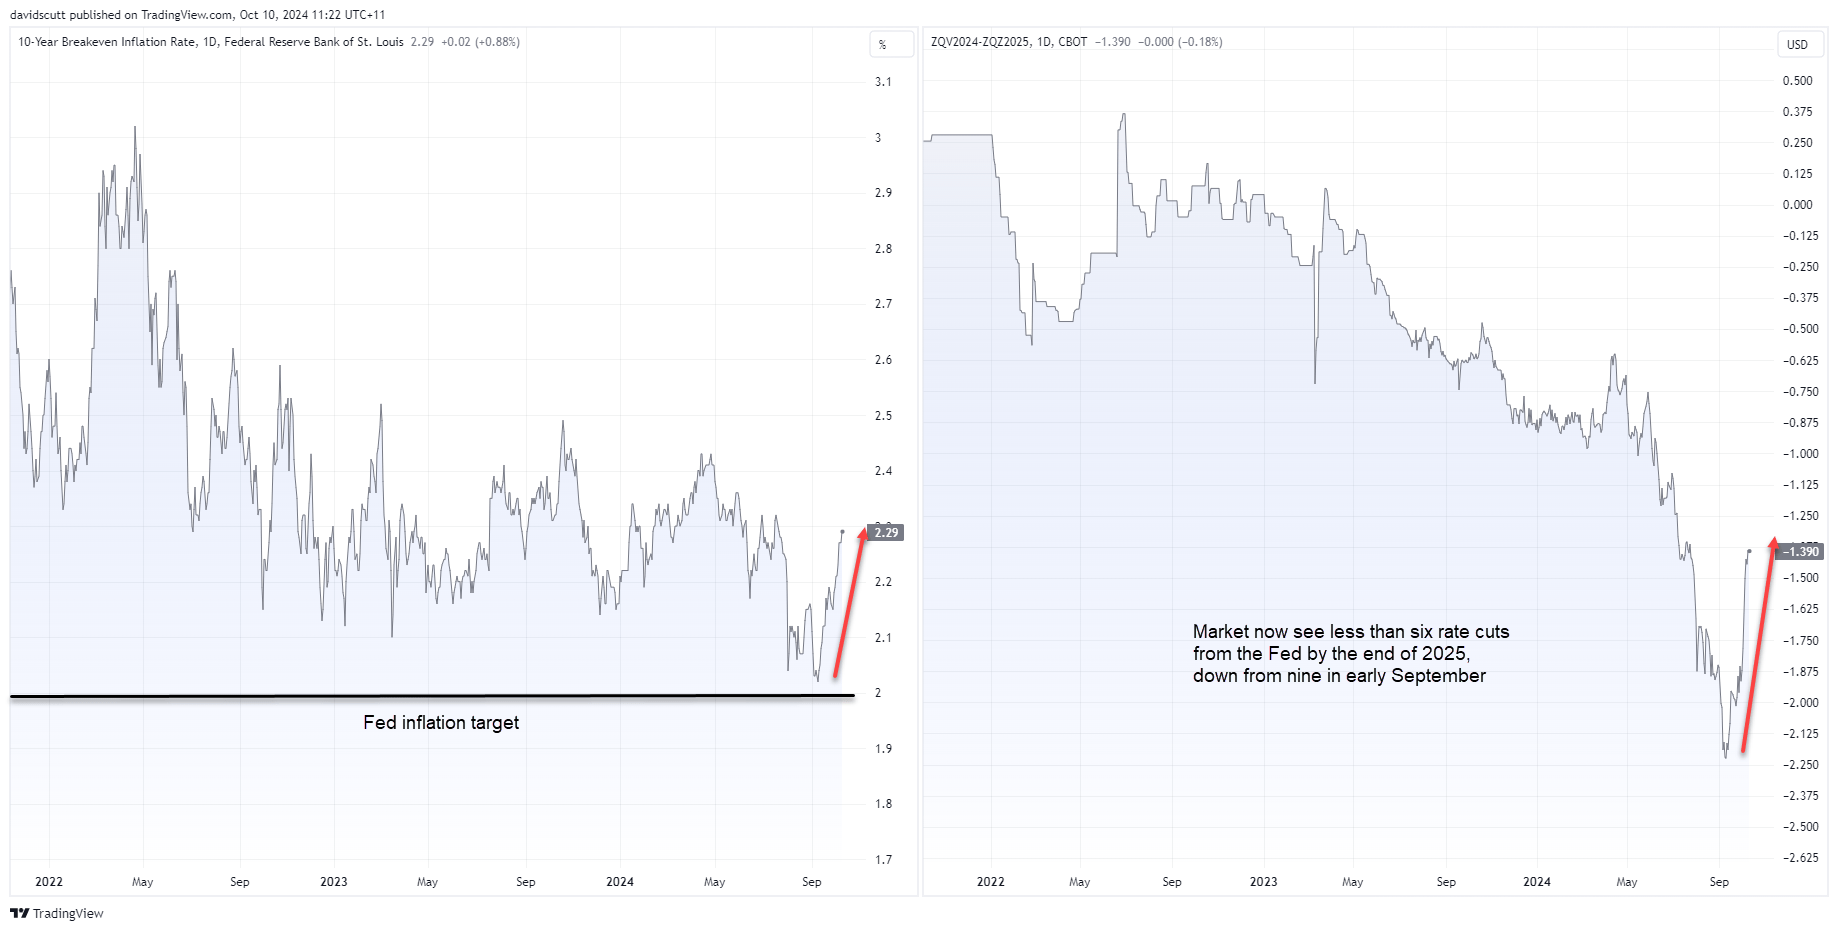
The next chart goes someway to explaining why US interest rates have been moving higher recently with market-based US 10-year inflation expectations, which track the expected average annual inflation rate over the next decade, pushing sharply higher over the past month, moving further away from the Fed’s mandated 2% target. At the same time, market expectations for rate cuts from the Fed out to the end of 2025 have been whittled away, falling from nine in early September to less than six today.
Continued strength in US economic activity and renewed evidence that labour market conditions remain tight is leading to growing expectations that inflation may pickup again, reducing the need for the Fed to cut rates aggressively.
US two-year Treasury note futures break long-running uptrend, eye 200DMA retest
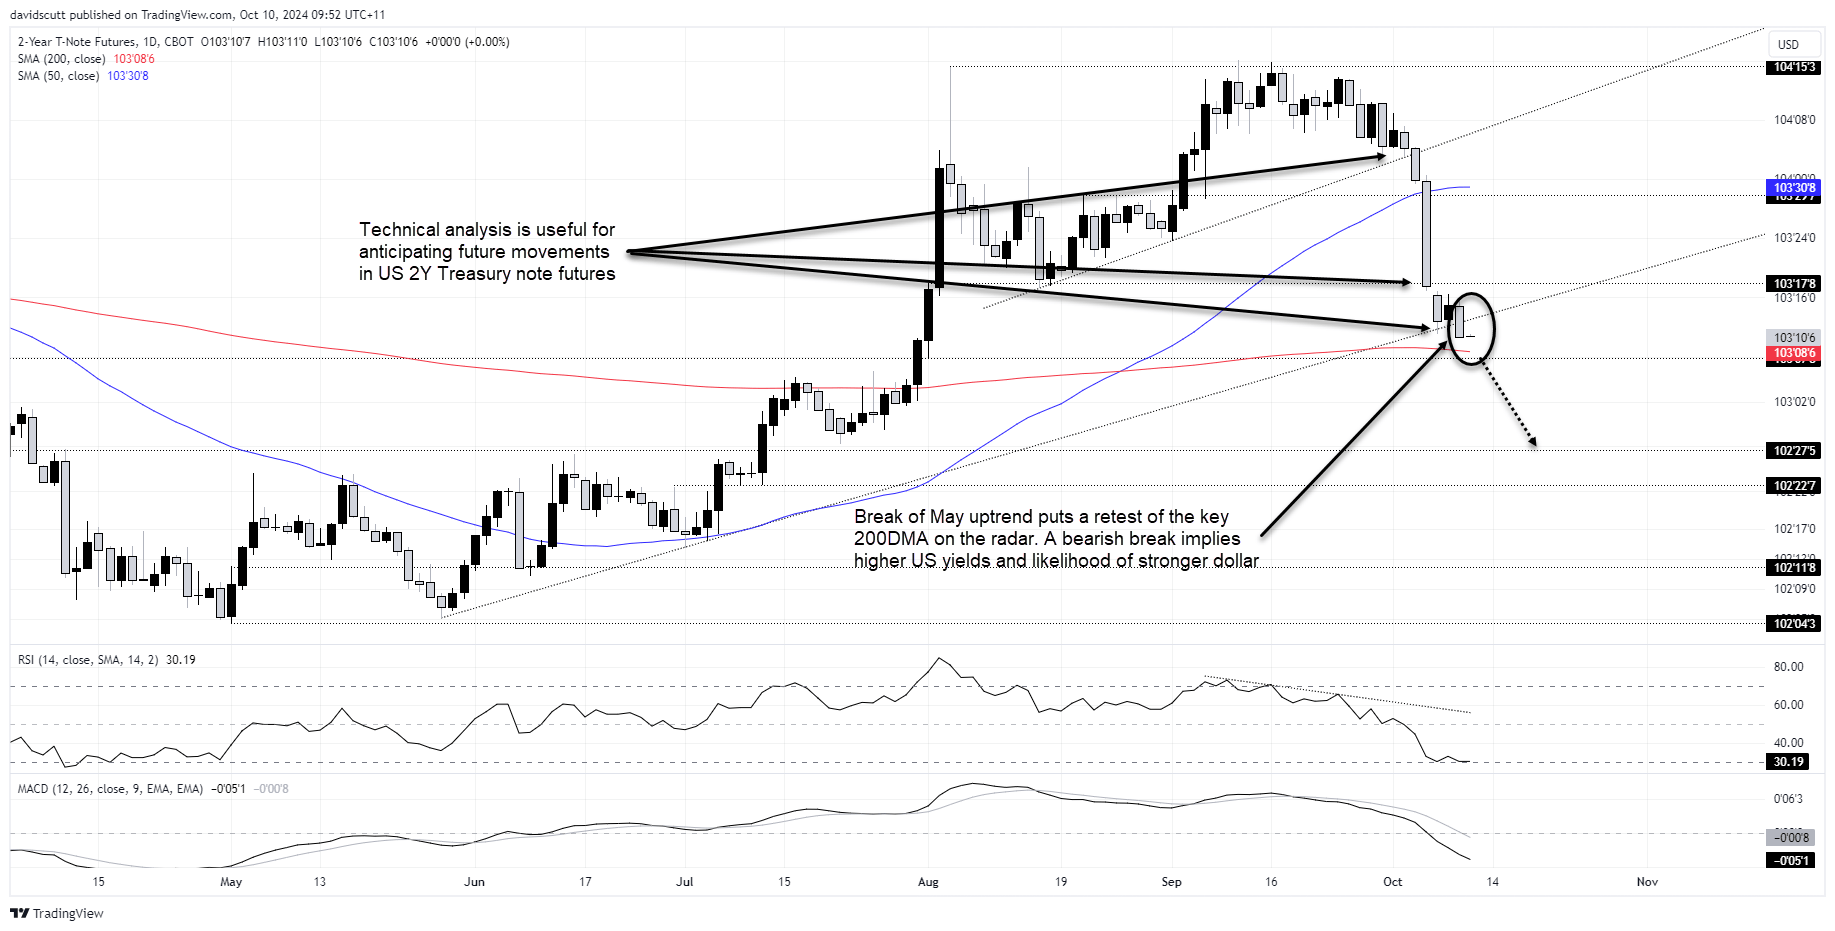
Those expectations are flowing through to short and longer-dated US debt markets, as seen in the chart below looking at US two-year Treasury note futures which have fallen sharply over the past fortnight. As prices move inversely to yields in debt securities, the weakness implies higher interest rates which we know are influencing USD/CHF and gold movements right now.
The recent pullback has already delivered some decent technical damage on the charts, including breaking the uptrend dating back to late May on Wednesday. If the break sticks it put the price on track for a retest of the 200-day moving average, a potentially important level when it comes to medium and longer-term directional risks. If the 200 were to give way, it points to higher US interest rates and likelihood of a stronger US dollar, repeating the pattern seen earlier this year.
As demonstrated by price movements, two-year note futures often respect known technical levels, providing traders with something akin to a filter for assessing trade setups for gold and USD/CHF. With short-end US debt securities threatening to break down further, unless the uptrend can be reclaimed, directional risks for USD/CHF and gold look higher and lower respectively.
USD/CHF grinding higher in uptrend
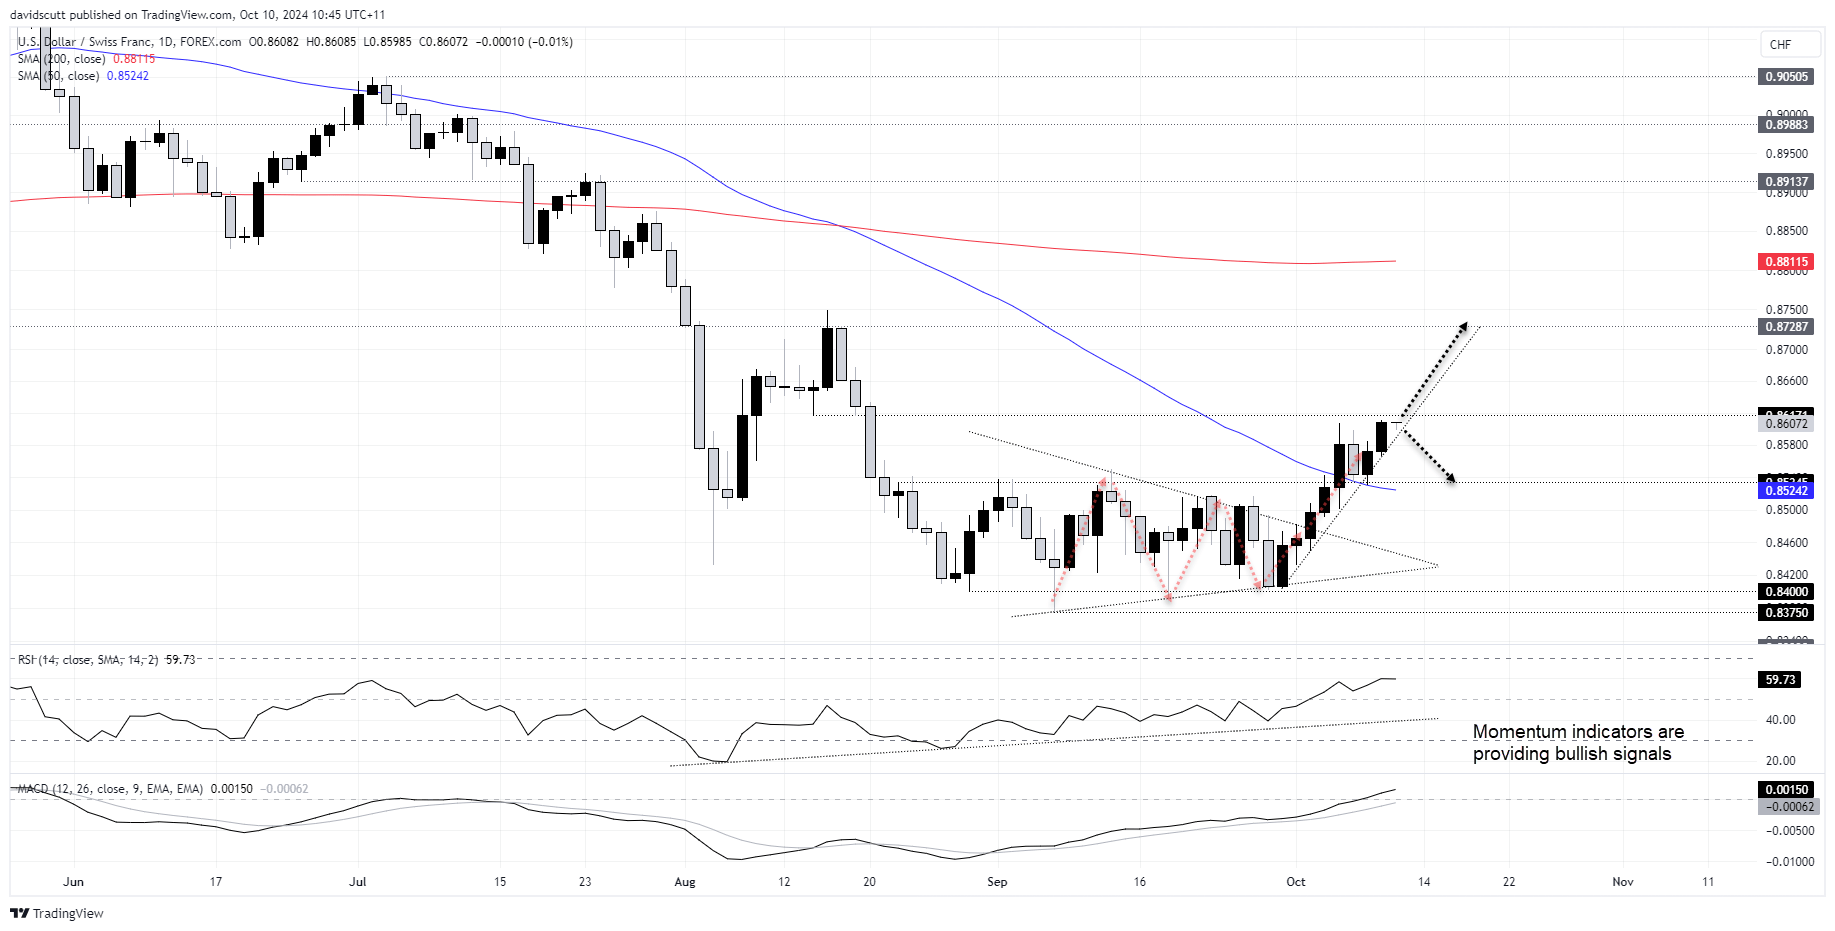
As flagged in a separate post, USD/CHF staged a bullish breakout of the triangle pattern it had been trading in earlier this month, doing away with a resistance zone including the 50-day moving average before continuing to push towards .8617, a level that offered minor support in August. If that level were to be broken cleanly, there’s not a lot of known levels in between until .87287, potentially allowing for longs to be established above the level with a stop beneath for protection.
Watch to see how the price interacts with the minor uptrend for clues on directional risks. For now, with MACD and RSI (14) providing bullish signals on momentum, dips towards and through it are being bought. If the uptrend were to be broken, look for a retracement back towards .85345/50DMA. Until we see a break, buying dips is favoured.
Gold heavy but still biased higher
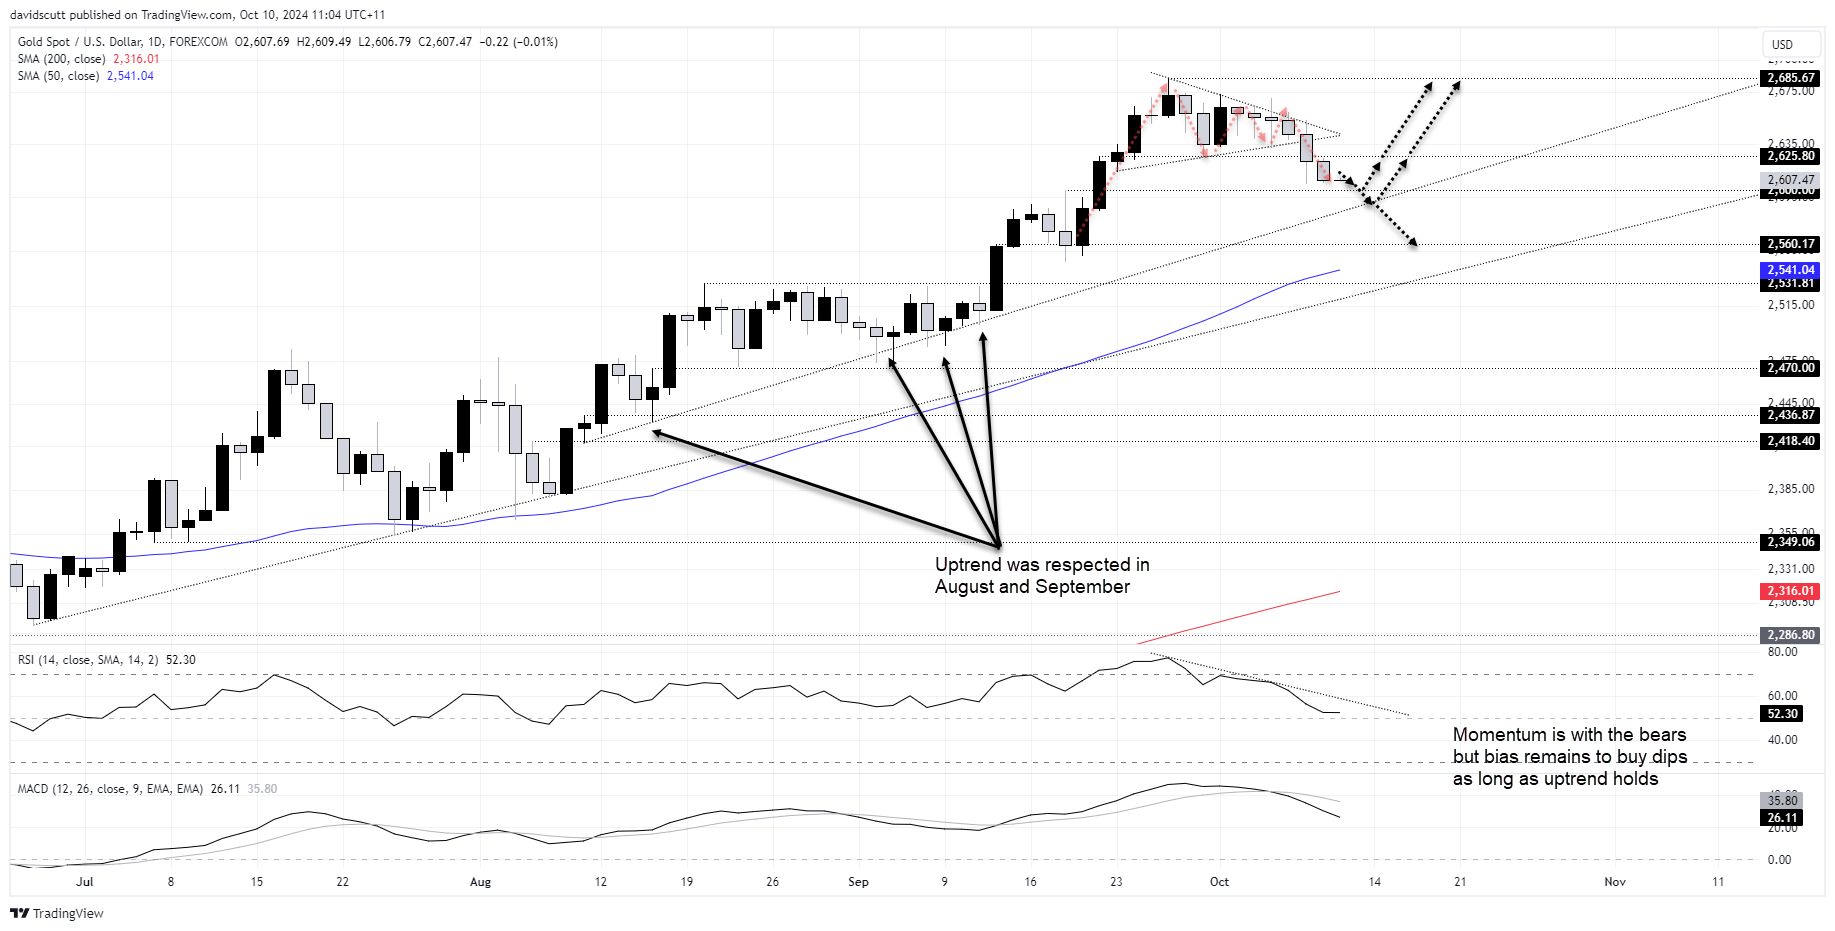
Gold appears heavy without looking disastrous on the charts, dribbling lower this week after breaking out of the triangle it had been coiling in since the middle of September.
While signals on momentum from MACD and RSI (14) remain bearish, with the price nearing $2600 with uptrend support located just below, setups from a price perspective look more appealing on the topside.
If we were to see a test and hold of $2600, you could establish longs with a stop beneath trendline support for protection. Another option would be to see whether the price tests the uptrend and bounces, allowing for bullish trades to be placed with a stop below for protection. Targets for both setups include $2625.80 and $2685.67.
If the price were to break and close below the uptrend, the trade could be flipped around, allowing for shorts to be established with a stop above for protection. Possible targets include $2560.17, the 50-day moving average or $2531.81.
-- Written by David Scutt
Follow David on Twitter @scutty
How to trade with City Index
You can trade with City Index by following these four easy steps:
- Open an account, or log in if you’re already a customer
• Open an account in the UK
• Open an account in Australia
• Open an account in Singapore
- Search for the market you want to trade in our award-winning platform
- Choose your position and size, and your stop and limit levels
- Place the trade
Related tags:
Latest market news




The complete CFD trading experience
Award-winning platforms, competitive spreads, low commissions and dedicated support.
We live and breathe the markets and are dedicated to helping traders realise their ambitions as we continue to set the industry bar.
Economic calendar
Web Trader platform
Our sophisticated web-based platform is packed with features.
Related articles
Blue wave adds to Nikkei’s AI troubles
The Nikkei 225 has taken another beating as a Democratic sweep adds to concerns about AI investment returns. But after the scale of the earlier declines, how much bad news is already priced in?
US dollar outlook: Nasdaq breakdown raises stakes for EUR/USD, USD/JPY
A potential Democratic sweep of Congress is adding to the AI trade's headaches, with Nasdaq 100 futures breaking below a major technical level. The implications for the dollar could be significant.
Gold Analysis: Resilient U.S. Labor Market Continues to Pressure XAU/USD
Recent trading sessions have not been particularly favorable for gold in the short term. XAU/USD has fallen nearly 2.5% over the last three sessions, reflecting that selling pressure is once again gaining relevance and that the metal continues to struggle to regain momentum.

StoneX Europe Ltd may make third party material available on this website which may contain information included but not limited to the conditions of financial markets. The material is for information purposes only and does not contain, and should not be construed as containing, investment advice and/or investment recommendation and/or an investment research and/or an offer of or solicitation for any transactions in financial instruments; any decision to enter into a specific transaction shall be made by the client following an assessment by him/her of their situation.
StoneX Europe Ltd makes no representation or warranty and assumes no liability as to the accuracy or completeness of the information provided, nor any loss arising from any investment based on a recommendation, forecast or other information supplied. You should always seek independent advice as to your suitability to speculate in any related markets and your ability to assume the associated risks, if you are at all unsure. We are not under any obligation to update any such material. Any opinion made may be personal to the author and may not reflect the opinion of StoneX Europe Ltd.