



Japanese Yen Outlook: USD/JPY, GBP/JPY, AUD/JPY Setups
USD/JPY and GBP/JPY show signs of stabilising, while AUD/JPY remains vulnerable as yen crosses deliver mixed technical signals.
Share this:

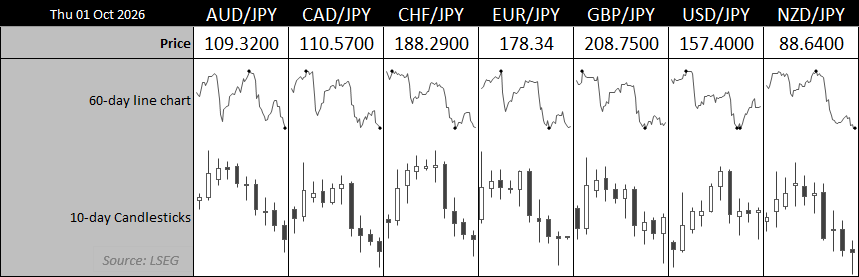
Japanese yen crosses are sending mixed technical signals. USD/JPY and GBP/JPY are showing signs of stabilising after recent declines, although both still face nearby resistance. AUD/JPY looks less convincing, with downside momentum keeping the March low and lower support levels in focus.
View related analysis:
Japanese Yen Setups Diverge Across USD/JPY, GBP/JPY and AUD/JPY
USD/JPY Technical Analysis: US Dollar vs Japanese Yen
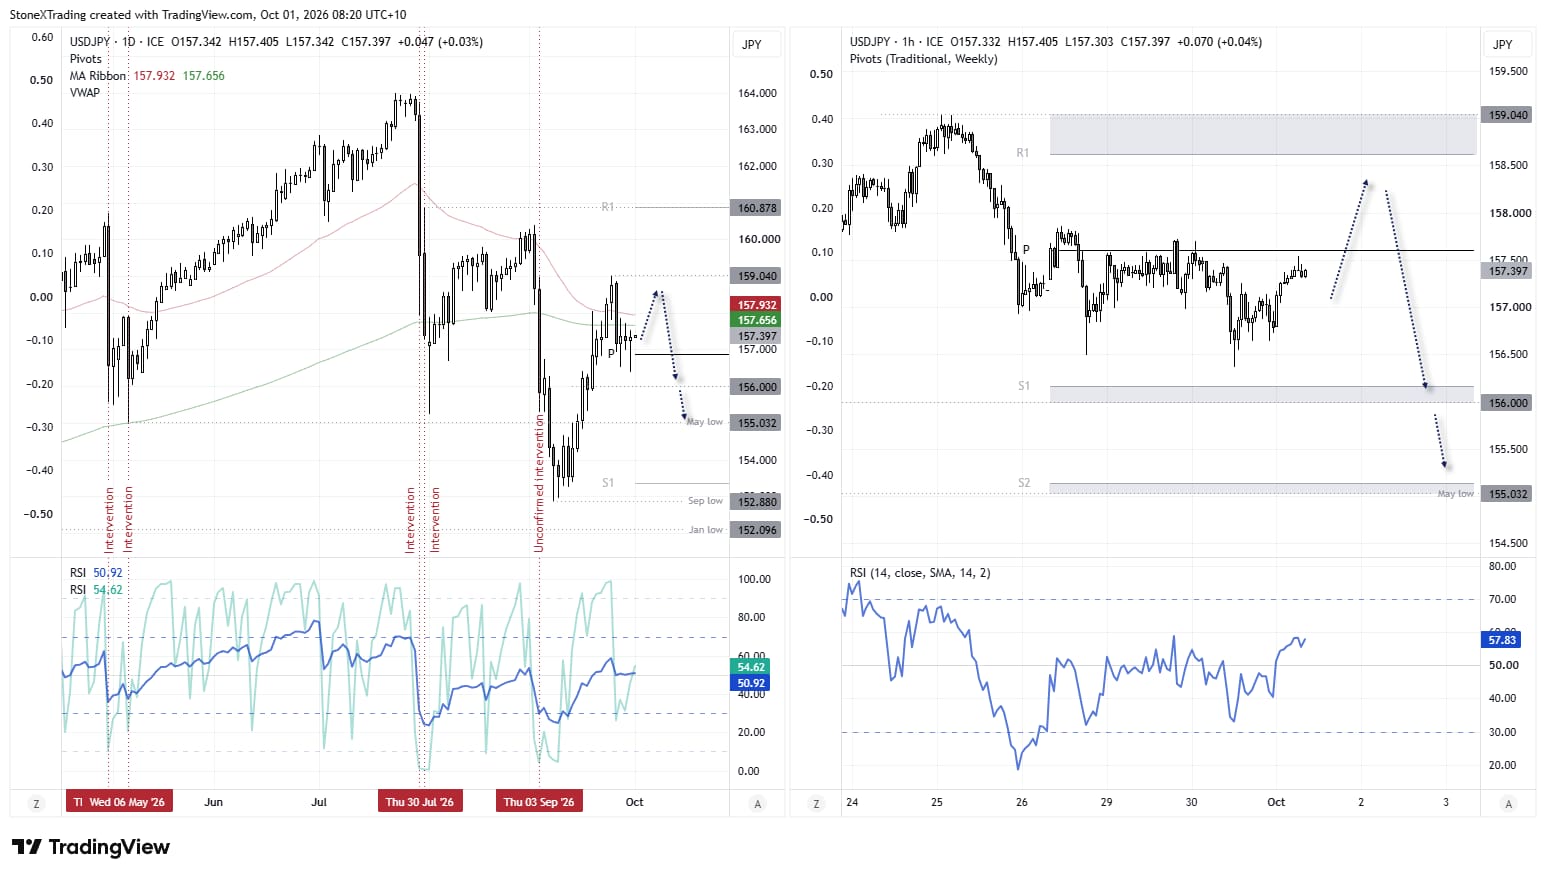
Friday’s bearish engulfing day suggests a near-term top is in place, though price action this week also suggests USD/JPY could recoup some of Friday’s losses. Three dojis have since formed, two with lower wicks to show demand above 156 and around the monthly pivot point.
The 200-day EMA and 50-day EMA are capping prices as resistance, so we could be in for some scrappy trade. And there may not be an immediate rush to get involved. Instead, recent price action could serve as a warning for bears to step aside and wait for a better opportunity.
Ideally, we’ll see evidence of a lower high relative to Thursday’s high just above 158. The 156 handle and May low at 155.03 are potential downside targets, a break beneath which brings the monthly S1 pivot into focus near the September low.
Source: ICE, TradingView

GBP/JPY Technical Analysis: British Pound vs Japanese Yen
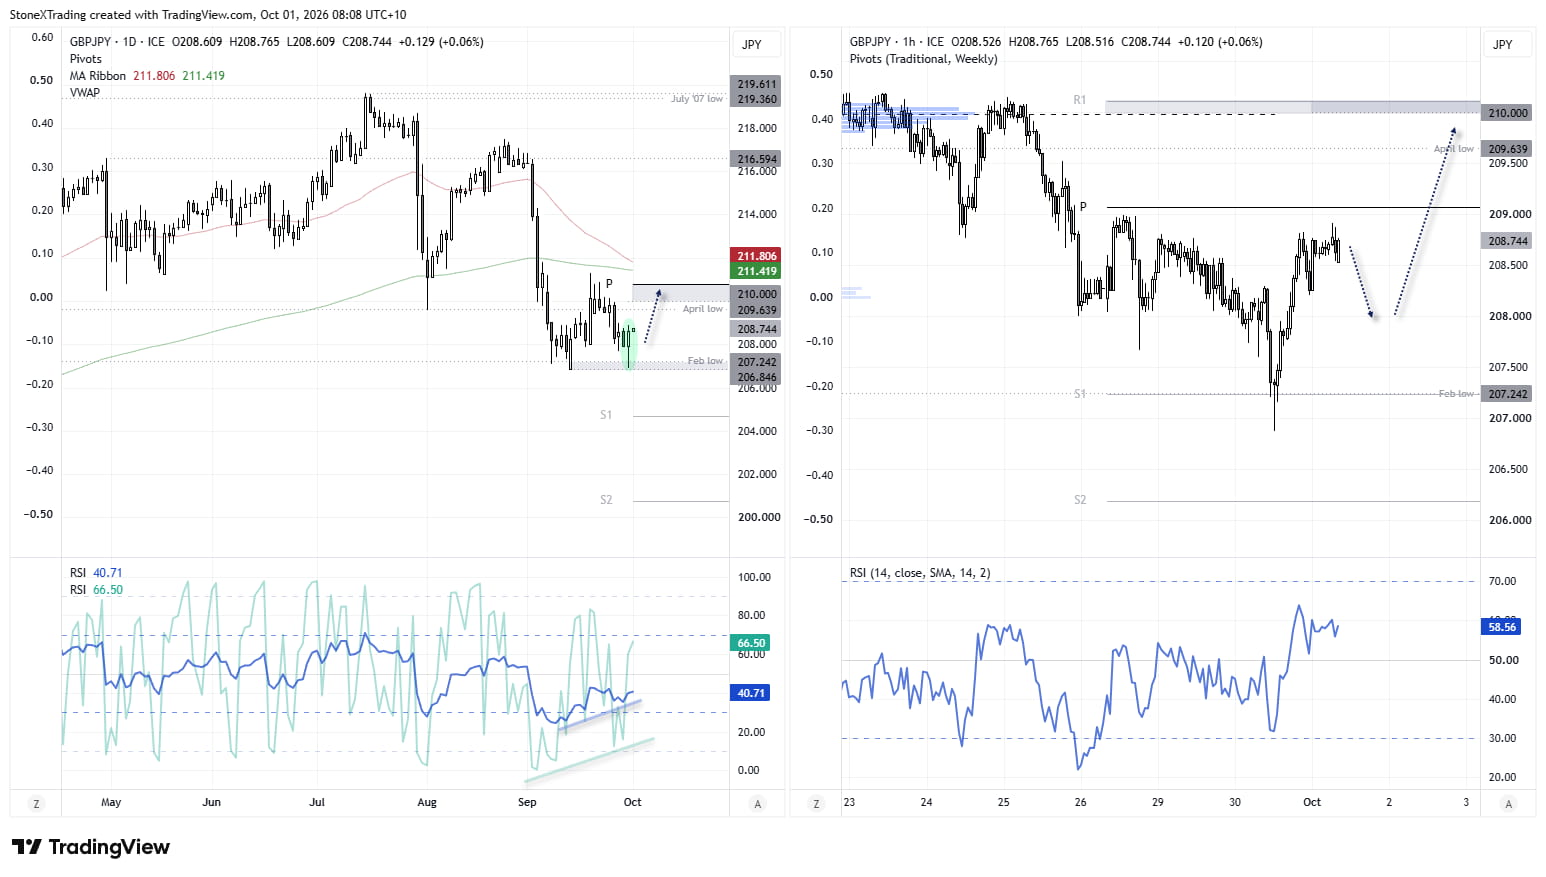
A bullish outside day formed on Wednesday to hint at a swing low. The fact that it occurred around the February and September lows adds to the near-term bullish case. Also note that the monthly S2 pivot is nearby for additional support.
The 1-hour chart shows that the rally has stalled just beneath the weekly pivot point, so perhaps a pullback is due. Bulls could seek dips within yesterday’s range while prices hold above 206.85. As this is a countertrend move, conservative upside targets seem more appropriate unless a decent bullish catalyst arrives.
The April low at 209.64 and the 210 handle - near the weekly R1 pivot and high-volume node - are potential upside targets for bulls over the near term.
Source: ICE, TradingView
AUD/JPY Technical Analysis: Australian Dollar vs Japanese Yen
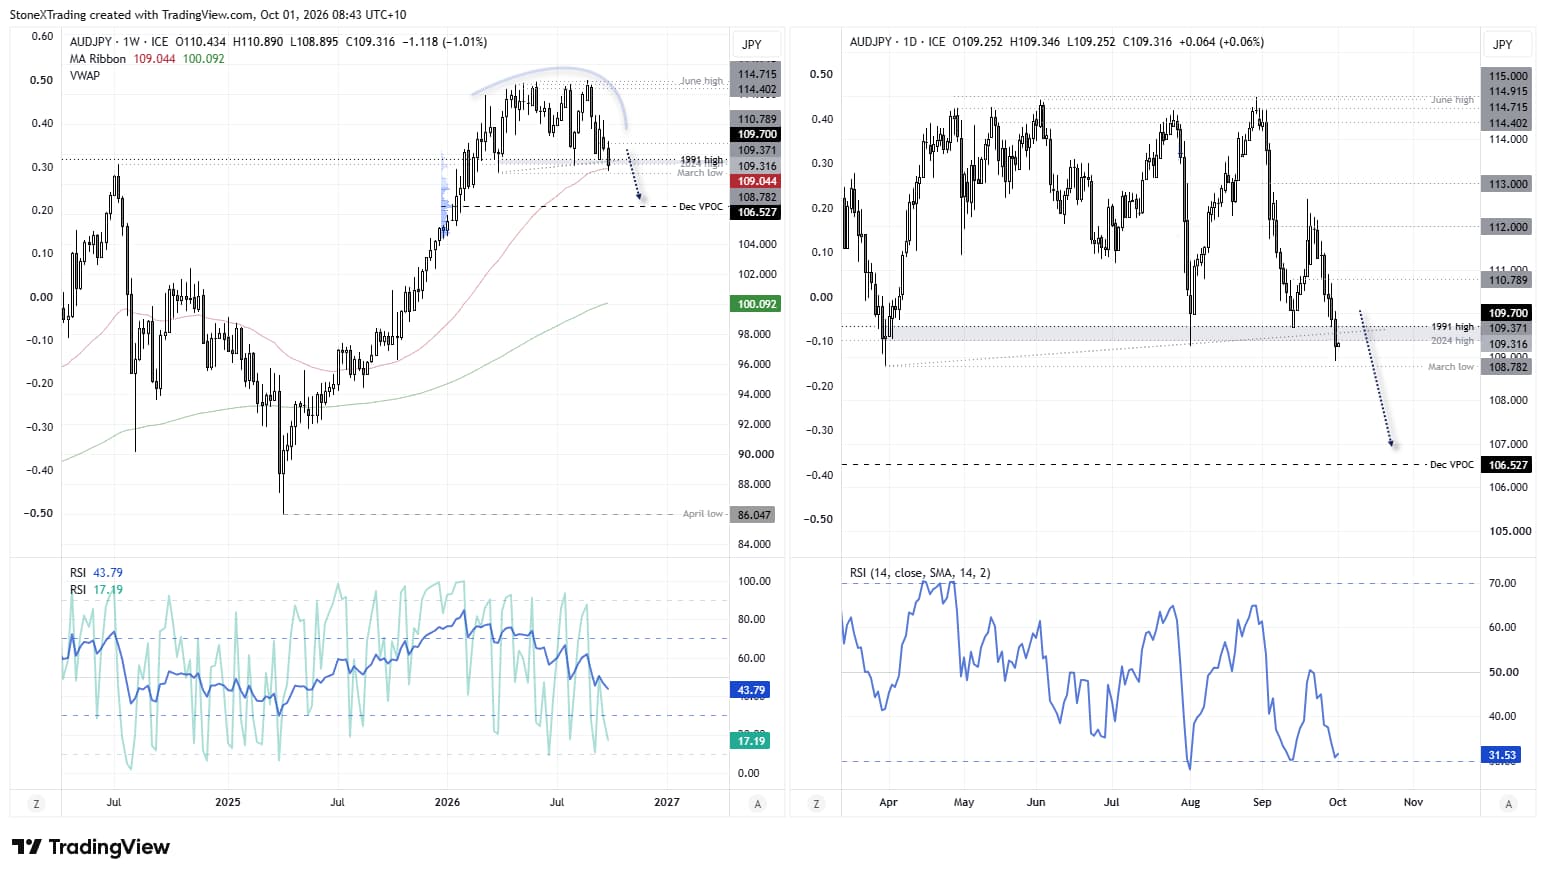
The Aussie yen is one of the few yen pairs that is not hinting at an imminent swing low. AUD/JPY is on track for a second consecutive weekly decline, and it appears that a much larger topping pattern is in play. It has found support at the 50-week EMA for now, though bearish momentum on the daily chart suggests AUD/JPY is also threatening to break the March low.
AUD/JPY remains on my ‘fade the rally’ watchlist, with a break of the March low bringing the 108 and 107 handles into focus, ahead of the December VPOC.
Source: ICE, TradingView
Related tags:
Latest market news




The complete CFD trading experience
Award-winning platforms, competitive spreads, low commissions and dedicated support.
We live and breathe the markets and are dedicated to helping traders realise their ambitions as we continue to set the industry bar.
Economic calendar
Web Trader platform
Our sophisticated web-based platform is packed with features.
Related articles
Swiss Franc Short-term Outlook: USD/CHF Selloff Nears Critical Support Ahead of NFP 11 4 2026
USD/CHF bears are closing in on critical trend support, with the next reaction likely to determine whether the October decline has further to run.

USD/CAD Forecast: Canadian Dollar Gains Ground After U.S. Midterm Elections
The trading week continues to unfold and the recovery in the Canadian dollar has once again become a relevant theme in the short term. This can be clearly seen in the recent performance of USD/CAD, which is down nearly 0.4% during the session, reflecting a consistent recovery in the CAD against the U.S. dollar.


Euro Technical Outlook: EUR/USD Support Reversal Sets Up Breakout Test Ahead of NFP 11 4 2026
Euro bulls are attempting to build on the rebound from recent lows, but pivotal resistance still stands in the way of a larger EUR/USD recovery.
StoneX Europe Ltd may make third party material available on this website which may contain information included but not limited to the conditions of financial markets. The material is for information purposes only and does not contain, and should not be construed as containing, investment advice and/or investment recommendation and/or an investment research and/or an offer of or solicitation for any transactions in financial instruments; any decision to enter into a specific transaction shall be made by the client following an assessment by him/her of their situation.
StoneX Europe Ltd makes no representation or warranty and assumes no liability as to the accuracy or completeness of the information provided, nor any loss arising from any investment based on a recommendation, forecast or other information supplied. You should always seek independent advice as to your suitability to speculate in any related markets and your ability to assume the associated risks, if you are at all unsure. We are not under any obligation to update any such material. Any opinion made may be personal to the author and may not reflect the opinion of StoneX Europe Ltd.