





Japanese yen reverts to safe haven asset, USD/JPY nears key support zone
USD/JPY is on a collision course with key support, plunging for a fourth consecutive day as carry trades involving the Japanese yen are unwound. It’s the kind of move you’d normally expect to see in a crisis, although we’re not in a crisis. Yet.
Share this:

- Japanese yen is behaving like a safe haven asset again
- USD/JPY slides violently after breaking 2024 uptrend
- Fed rate expectations are playing a lesser role in influencing movements
- Relationship with US stock futures has strengthened noticeably in recent weeks
USD/JPY rout nears key inflection point
USD/JPY is on a collision course with key support, plunging for a fourth consecutive day as carry trades involving the Japanese yen are unwound. It’s the kind of move you’d normally expect to see in a crisis, although we’re not in a crisis. Yet. The longer this goes on, the closer we get to a seriously large risk-off episode. For now, what happens in the near-term could play a key role in determining just how bad things get.
Just look at that weekly candle
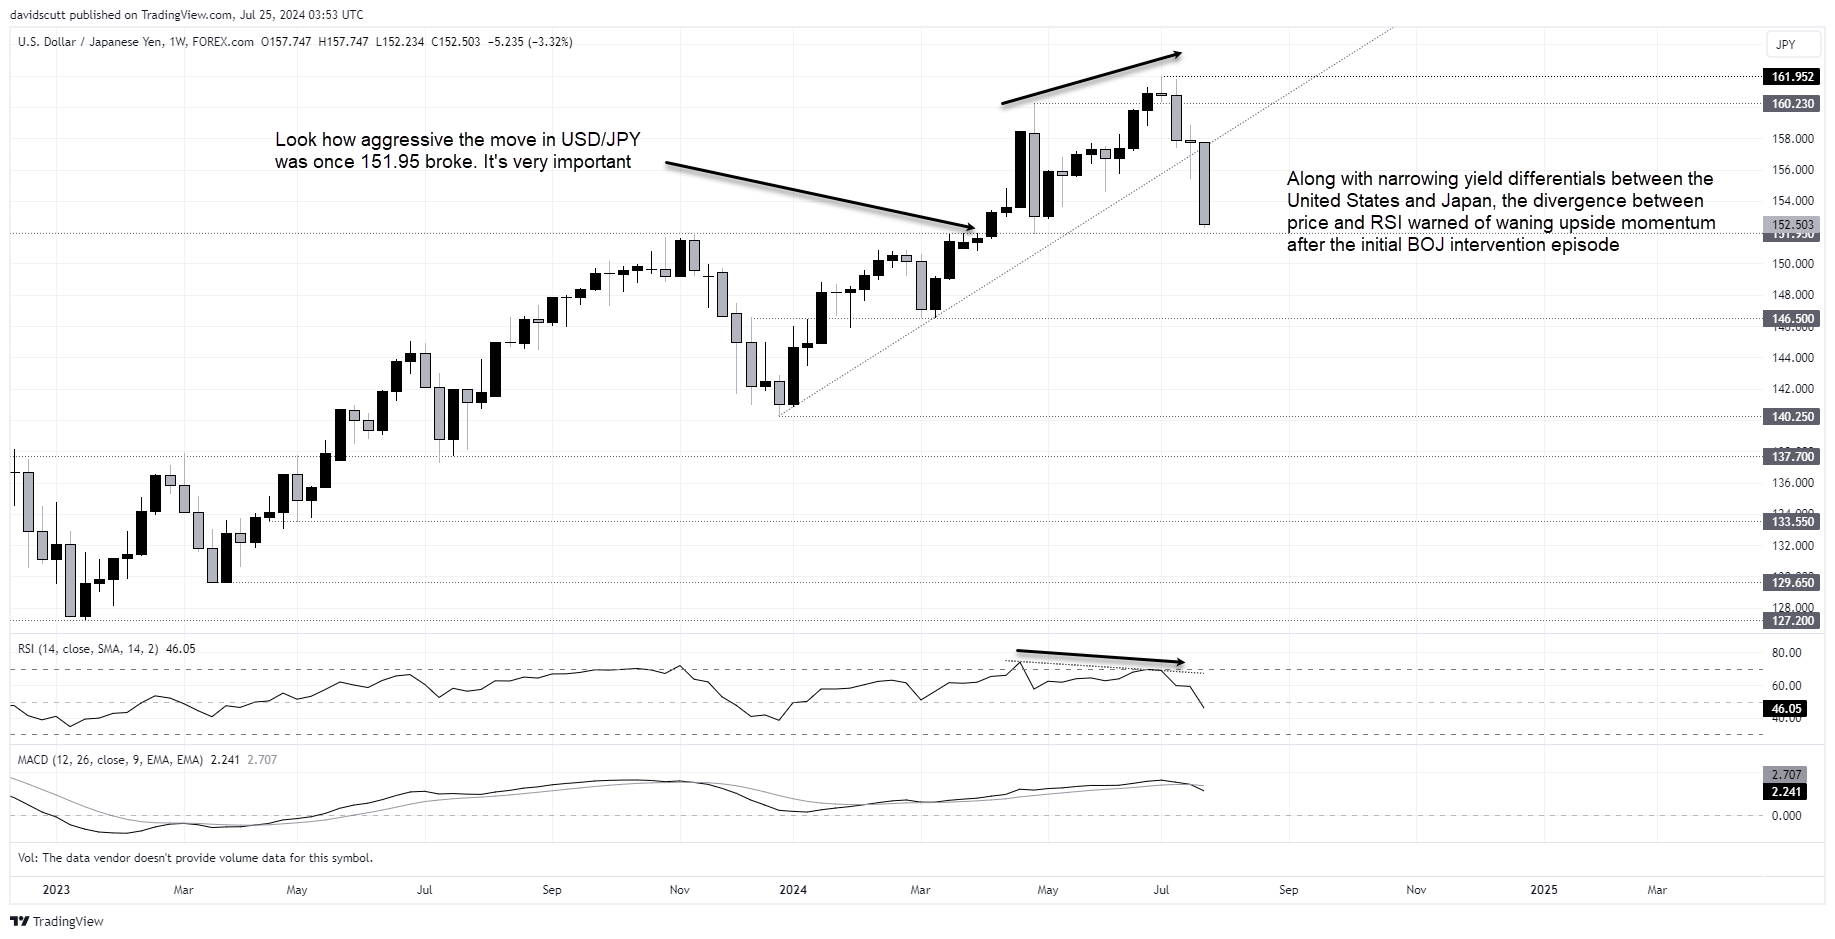
To start, I just want to zoom out to the weekly timeframe to get a better sense as to just how significant this downside flush has been. Having taken out the uptrend that began late last year, it’s been nothing but one-way traffic since.
You can see just how close USD/JPY is now to 151.95, a major support zone traders spent months fretting whether to cross earlier this year in fear of the Bank of Japan intervention. You can see how important it is by how far dollar-yen surged after breaking through the level.
151.95 top of key support zone
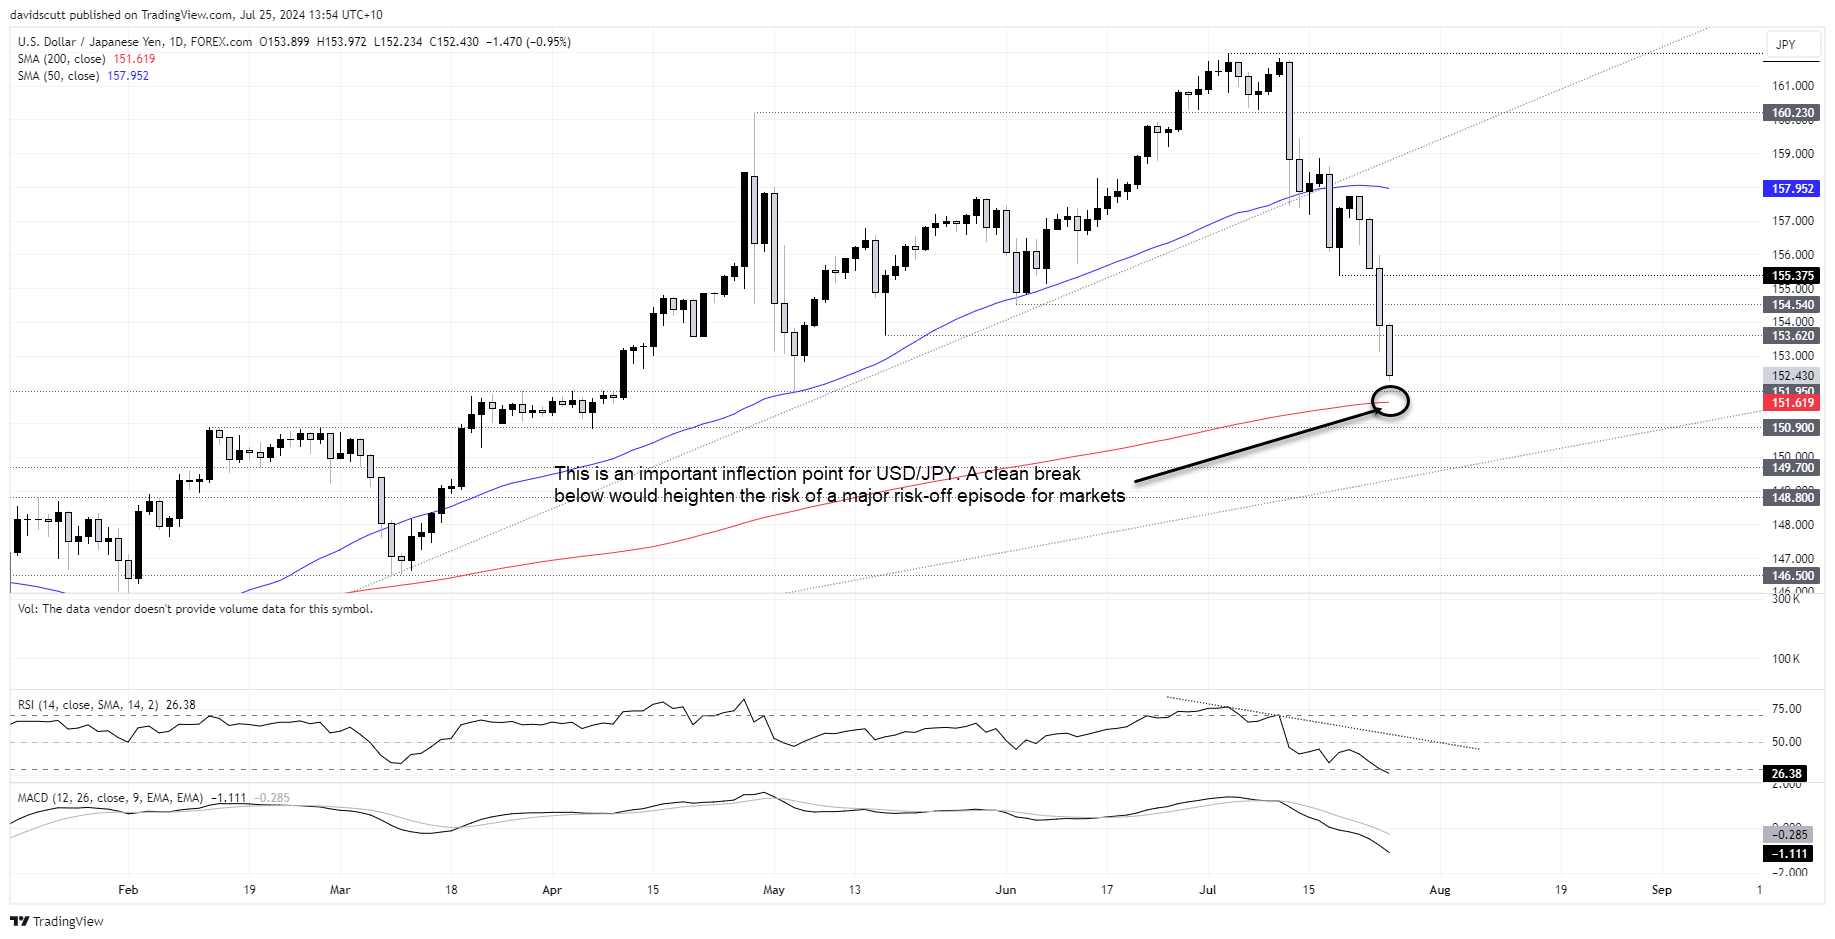
It’s doubly important when you zoom in to the daily timeframe and see the 200-day moving average is located just below at 151.61. Combined, the 34 pips between the two levels looms as potential fork in the road for USD/JPY. Will it hold and facilitate a short-covering bounce and reestablishment of carry trades, or will it buckle leading to potential turmoil?
I’m questioning whether we’re standing on the precipice of the crisis – it doesn’t feel like one, and I’ve seen a fair few in my time. But I know what I’ll be watching: risk assets
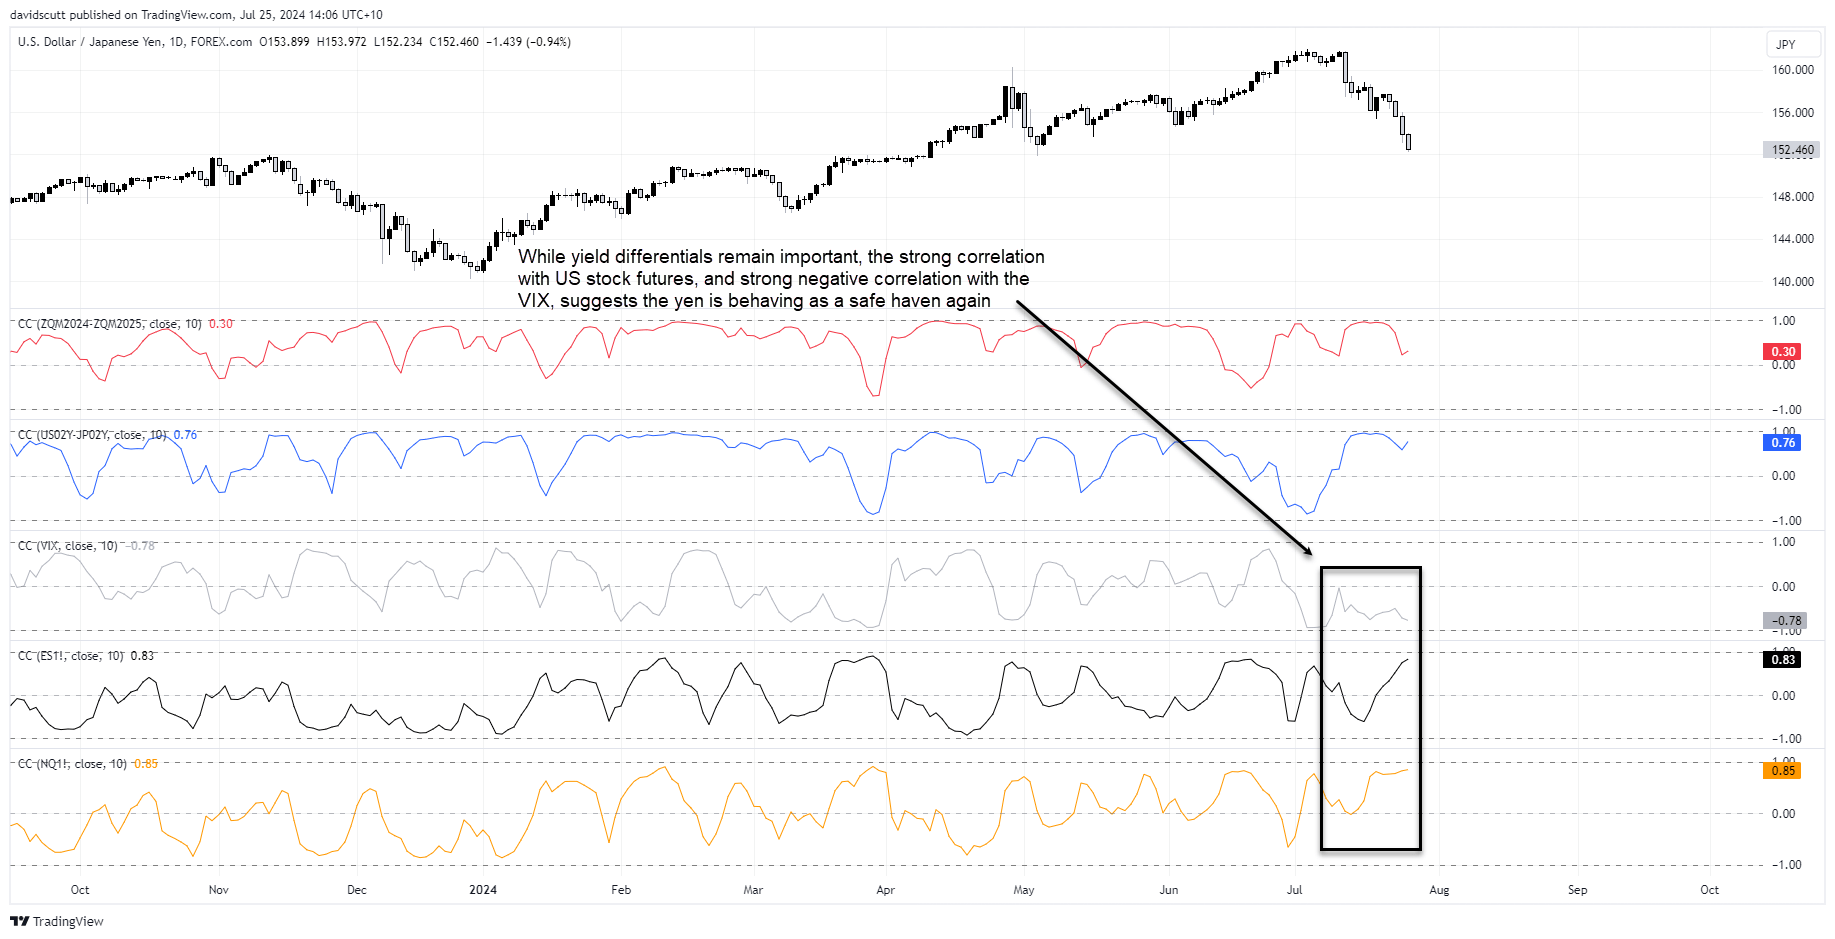
This next chart explains why.
Yen a safe haven again?
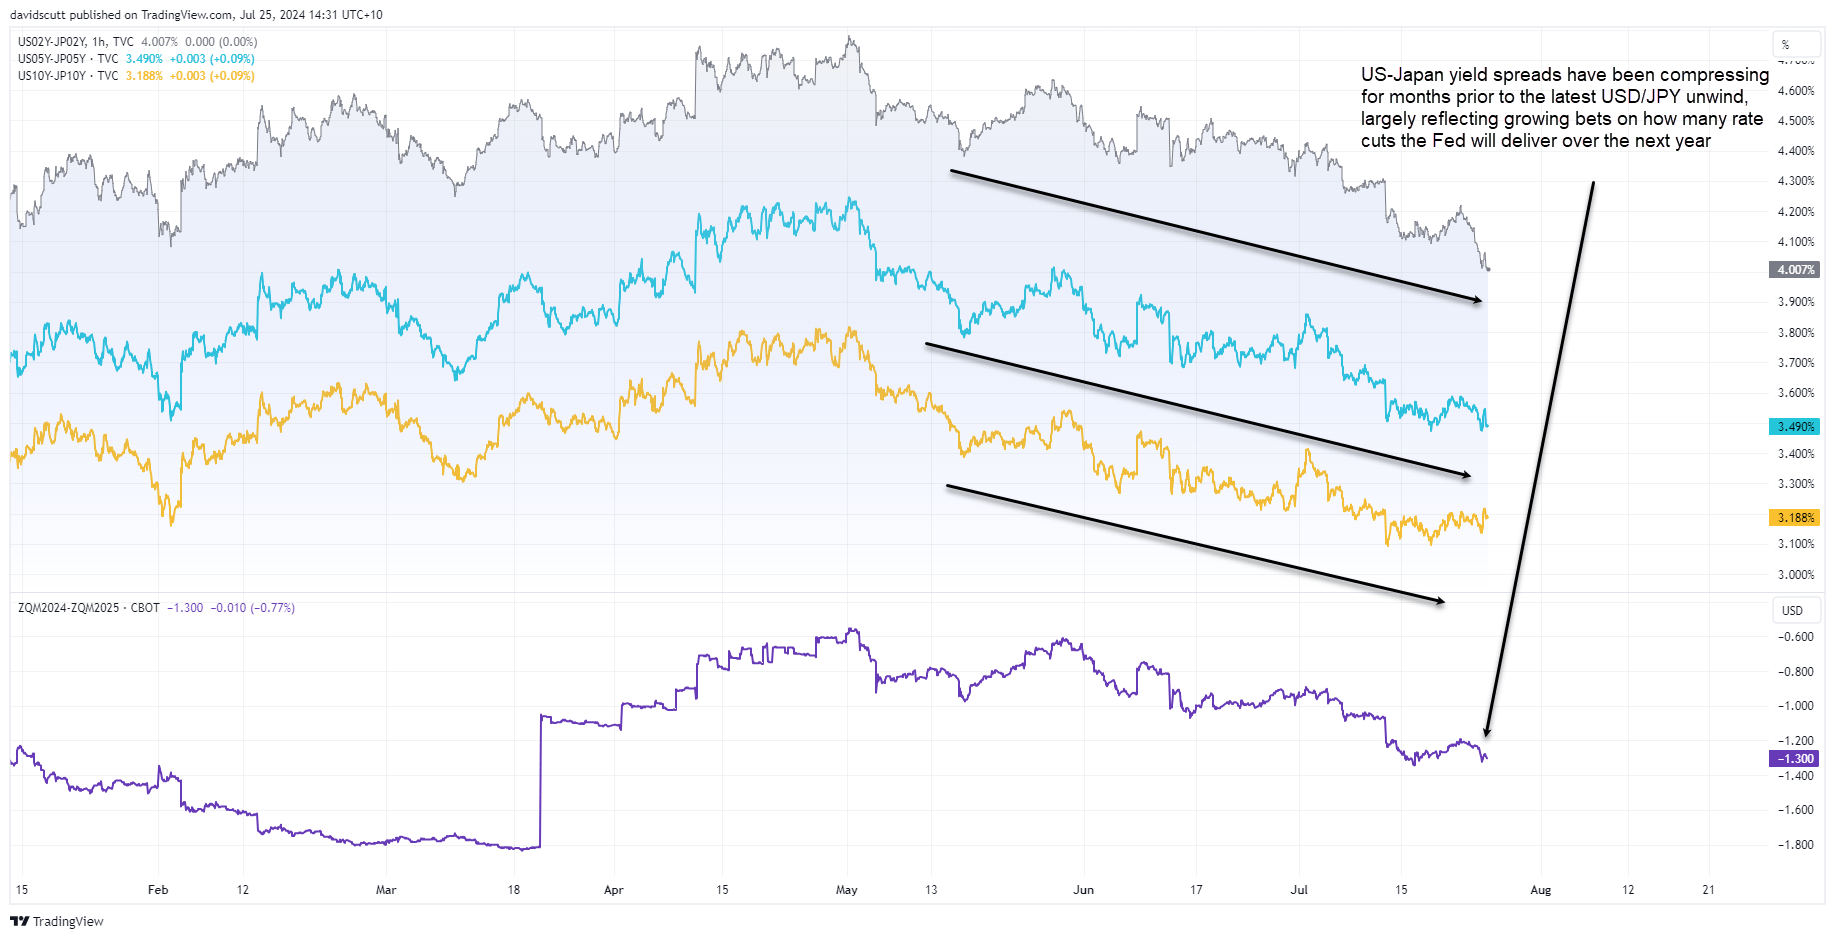
While the relationship between dollar-yen and short end rate differentials has remained strong over the past fortnight, there’s been a changing of the guard in terms of market driver.
The correlation with the S&P and Nasdaq has strengthened noticeably over this period. The inverse correlation with the VIX has also strengthened, with the two moving in different directions with increased frequency.
Put simply, it looks like the yen has reverted to its old role as a safe haven, benefitting from repatriation flows from all corners of the globe. That suggests traders should watch for confirmation signals from risker asset classes before initiating positions in USD/JPY.
-- Written by David Scutt
Follow David on Twitter @scutty
How to trade with City Index
You can trade with City Index by following these four easy steps:
- Open an account, or log in if you’re already a customer
• Open an account in the UK
• Open an account in Australia
• Open an account in Singapore
- Search for the market you want to trade in our award-winning platform
- Choose your position and size, and your stop and limit levels
- Place the trade
Related tags:

The complete CFD trading experience
Award-winning platforms, competitive spreads, low commissions and dedicated support.
We live and breathe the markets and are dedicated to helping traders realise their ambitions as we continue to set the industry bar.
Economic calendar
Web Trader platform
Our sophisticated web-based platform is packed with features.
Related articles

BTC/USD: Dead-cat bounce or the start of another recovery?
Bitcoin has bounced aggressively after another test of its 50-day moving average, but tech futures remain under pressure. With equity correlations strengthening and bearish momentum building, can BTC/USD sustain the recovery?

GBP/AUD falling wedge points to bullish breakout risk ahead of RBA minutes
GBP/AUD is forming a potential bullish continuation pattern, with RBA minutes, Australian unemployment and Bank of England commentary among the catalysts that could spark a breakout.

EUR/USD Forecast: Euro Slips to 17-Month Lows, 1.11 Next?
EUR/USD is trading at 17-month lows near 1.1160 as political developments in Germany and Spain inject uncertainty into the euro’s outlook - where is the next support ahead of US CPI?

StoneX Europe Ltd may make third party material available on this website which may contain information included but not limited to the conditions of financial markets. The material is for information purposes only and does not contain, and should not be construed as containing, investment advice and/or investment recommendation and/or an investment research and/or an offer of or solicitation for any transactions in financial instruments; any decision to enter into a specific transaction shall be made by the client following an assessment by him/her of their situation.
StoneX Europe Ltd makes no representation or warranty and assumes no liability as to the accuracy or completeness of the information provided, nor any loss arising from any investment based on a recommendation, forecast or other information supplied. You should always seek independent advice as to your suitability to speculate in any related markets and your ability to assume the associated risks, if you are at all unsure. We are not under any obligation to update any such material. Any opinion made may be personal to the author and may not reflect the opinion of StoneX Europe Ltd.