



Nasdaq 100 Bulls Seek Swing Low, Though COT Positioning Lacks Conviction
Nasdaq 100 futures are trying to establish a swing low, but COT positioning shows traders remain cautious despite improving technical signals.
Share this:

Nasdaq 100 futures are attempting to establish a swing low after a three-wave decline, with bullish technical signals emerging on the daily chart. However, the latest COT report reveals that both large speculators and asset managers have been reducing exposure rather than embracing the recent rebound, leaving the sustainability of any rally open to question.
View related analysis:
View related analysis:
Nasdaq Futures (NQ) Market Positioning | COT Report
We’re seeing a mixed picture for the tech sector among Wall Street futures traders. Large speculators flipped to net-short exposure back in early May, although in recent weeks we’ve seen a notable decline in both long and short positions. This suggests large speculators are de-risking their Nasdaq futures exposure rather than simply betting aggressively against the index.
Meanwhile, net-long exposure among asset managers has fallen by around a third in just six weeks. However, the main driver has been the closing of gross long positions rather than a surge in short bets.
To me, this suggests traders remain cautious towards the Nasdaq around its record highs, but they are not outright bearish. The AI theme appears to be losing some of its sparkle, so it makes sense that some traders are questioning whether the index could see a pullback before attempting to break to fresh record highs.
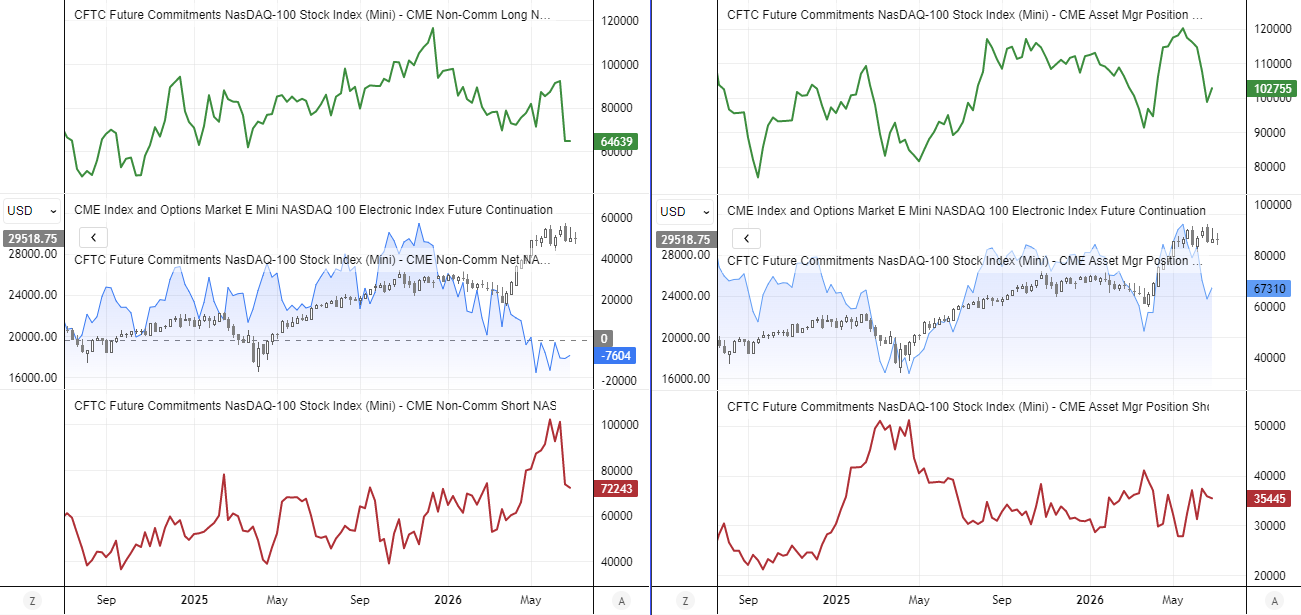
Source: CME, CFTC (COT), LSEG


Nasdaq 100 Futures Technical Analysis: Bullish Divergence Signals Potential Swing Low
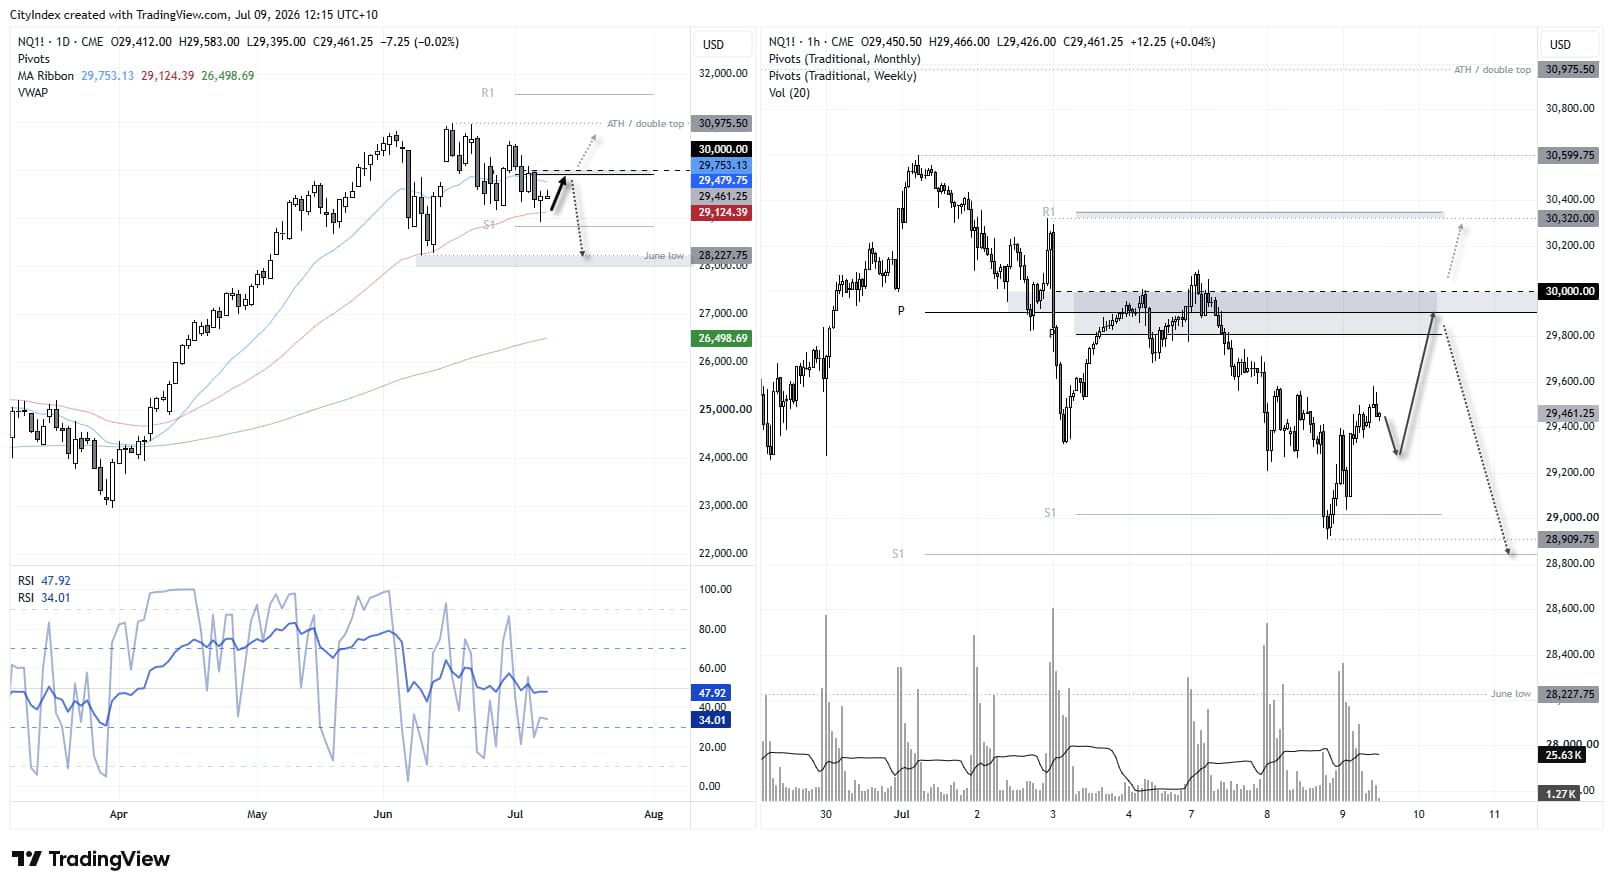
Price action on the Nasdaq 100 futures chart has been choppy since it printed a double top just shy of the 31,000 record high. While bears have clearly had the upper hand, it appears we've now seen a three-wave move lower and the market is attempting to find support.
Note that a bullish pin bar formed on Wednesday, with its low holding above the monthly pivot point before closing above the 50-day EMA. The lower wick also pierced both the June 26 low and the 29,000 handle before prices closed back above them. Furthermore, the daily RSI (2) has formed a bullish divergence. This suggests a swing low may have formed, or that the Nasdaq 100 is close to establishing one.
The question now may be more about how high bulls can take the rebound, assuming they can at all. The monthly pivot point sits just below 30,000, making it a likely resistance zone over the near term. Beyond that, the swing high around 30,500 could also stymie an immediate retest of the record high without a genuine risk-on catalyst.
Source: CME, CFTC (COT), LSEG
Nasdaq 100 Futures (NQ): Low Volume Keeps Recovery in Check
The 1-hour chart shows that the recent volume spike occurred alongside a bearish candle, while volumes during the subsequent rally have remained subdued. This suggests the recent advance lacks strong conviction. Prices may retrace within yesterday's range, improving the risk-to-reward profile for bulls. The weekly pivot point at 29,800 and the 30,000 level appear to be viable upside targets, although traders should also be alert to the risk of bears fading any rally into those levels.
View the full economic calendar
View the full economic calendar
-- Written by Matt Simpson
Follow Matt on Twitter @cLeverEdge
How to trade with City Index
You can trade with City Index by following these four easy steps:
- Open an account, or log in if you’re already a customer
• Open an account in the UK
• Open an account in Australia
• Open an account in Singapore
- Search for the market you want to trade in our award-winning platform
- Choose your position and size, and your stop and limit levels
- Place the trade
Related tags:




The complete CFD trading experience
Award-winning platforms, competitive spreads, low commissions and dedicated support.
We live and breathe the markets and are dedicated to helping traders realise their ambitions as we continue to set the industry bar.
Economic calendar
Web Trader platform
Our sophisticated web-based platform is packed with features.
Related articles

Silver forecast: metals liquidation drags XAG/USD into $50-55 support
Silver has broken its July low and slipped into a long-term support zone as the selling in precious metals deepens. The chart shows where the metal could bottom, and next week's Fed decision may decide whether it does.


Nasdaq 100 Forecast: NDX Falls as the tech rout continues and oil prices soar
U.S. stocks are pointing to a modestly lower open after a sharp AI sell-off yesterday, as telecom stocks slide. Brent rises towards $115 adding to inflation pressures ahead of the FOMC rate decision.


S&P 500 forecast: AI linked stocks remain under pressure
And just like that, it is Friday again and the end of a volatile week. Today offers little on the macro calendar to change the prevailing narrative, leaving markets largely at the mercy of risk appetite, oil prices and the growing unease around the AI trade.
StoneX Europe Ltd may make third party material available on this website which may contain information included but not limited to the conditions of financial markets. The material is for information purposes only and does not contain, and should not be construed as containing, investment advice and/or investment recommendation and/or an investment research and/or an offer of or solicitation for any transactions in financial instruments; any decision to enter into a specific transaction shall be made by the client following an assessment by him/her of their situation.
StoneX Europe Ltd makes no representation or warranty and assumes no liability as to the accuracy or completeness of the information provided, nor any loss arising from any investment based on a recommendation, forecast or other information supplied. You should always seek independent advice as to your suitability to speculate in any related markets and your ability to assume the associated risks, if you are at all unsure. We are not under any obligation to update any such material. Any opinion made may be personal to the author and may not reflect the opinion of StoneX Europe Ltd.