



Nasdaq 100 Coils Ahead of ASML Earnings as AI Leadership Faces a Test
The Nasdaq 100 consolidates ahead of ASML earnings as leadership fades, market breadth improves and traders await fresh clues on AI demand.
Share this:

The Nasdaq 100 heads into a pivotal week of earnings in consolidation mode, with semiconductor equipment giant ASML due to report before Wednesday's US open. The results will be closely scrutinised for clues on AI-related capital spending, customer demand and forward guidance, particularly after recent volatility in chip stocks has raised questions over the durability of the AI trade.
View related analysis:
View related analysis:
Nasdaq Consolidates Ahead of ASML's AI Earnings Test
Beneath the surface, leadership has begun to shift ahead of earnings season. While the Nasdaq 100 continues to consolidate near record highs, its relative performance versus the Dow Jones Industrial Average, S&P 500 and broader Nasdaq Composite has weakened since early June. The improving percentage of stocks trading above their 200-day moving average also points to broader market participation, suggesting investors have been rotating beyond the largest technology names rather than exiting equities altogether.
That puts semiconductor equipment maker ASML firmly in the spotlight. As the first major AI bellwether to report this earnings season, its outlook on customer investment, AI-related demand and capital expenditure could determine whether the Nasdaq 100 regains market leadership or whether the recent rotation into the broader market gathers further momentum.
Source: NASDAQ, LSEG
- Orange (NDX/DJI): Nasdaq has underperformed the Dow since early June.
- Magenta (NDX/SPX): Nasdaq has also lost ground relative to the S&P 500.
- Blue (NDX/IXIC): Mega-cap tech has underperformed the broader Nasdaq Composite, pointing to broader market leadership.
Nasdaq Leadership Fades Ahead of Earnings
Whether that rotation proves healthy or marks the beginning of broader weakness may depend on what ASML says about AI demand and semiconductor investment. As the world's leading supplier of extreme ultraviolet (EUV) lithography machines, ASML sits at the heart of the AI supply chain, making its outlook one of the most important early reads on the health of the sector ahead of TSMC and the Magnificent Seven earnings later this month.


ASML Stock Technical Analysis
It has been just eight days since ASML last printed a record high, yet the stock has fallen as much as 14% from its peak. While a weak earnings report could trigger a much deeper pullback and weigh on Nasdaq sentiment, there are technical clues suggesting the bulls may not be finished with the trend just yet.
Price action has become increasingly choppy on the daily chart, but it also appears to be carving out a falling wedge—a pattern often associated with bullish reversals within an established uptrend. Prices are also attempting to hold above the 50-day EMA and a prominent high-volume node (HVN). Note the double bottom around 1,720, while Tuesday's narrow-range doji formed on elevated volume, hinting that buyers may be defending support.
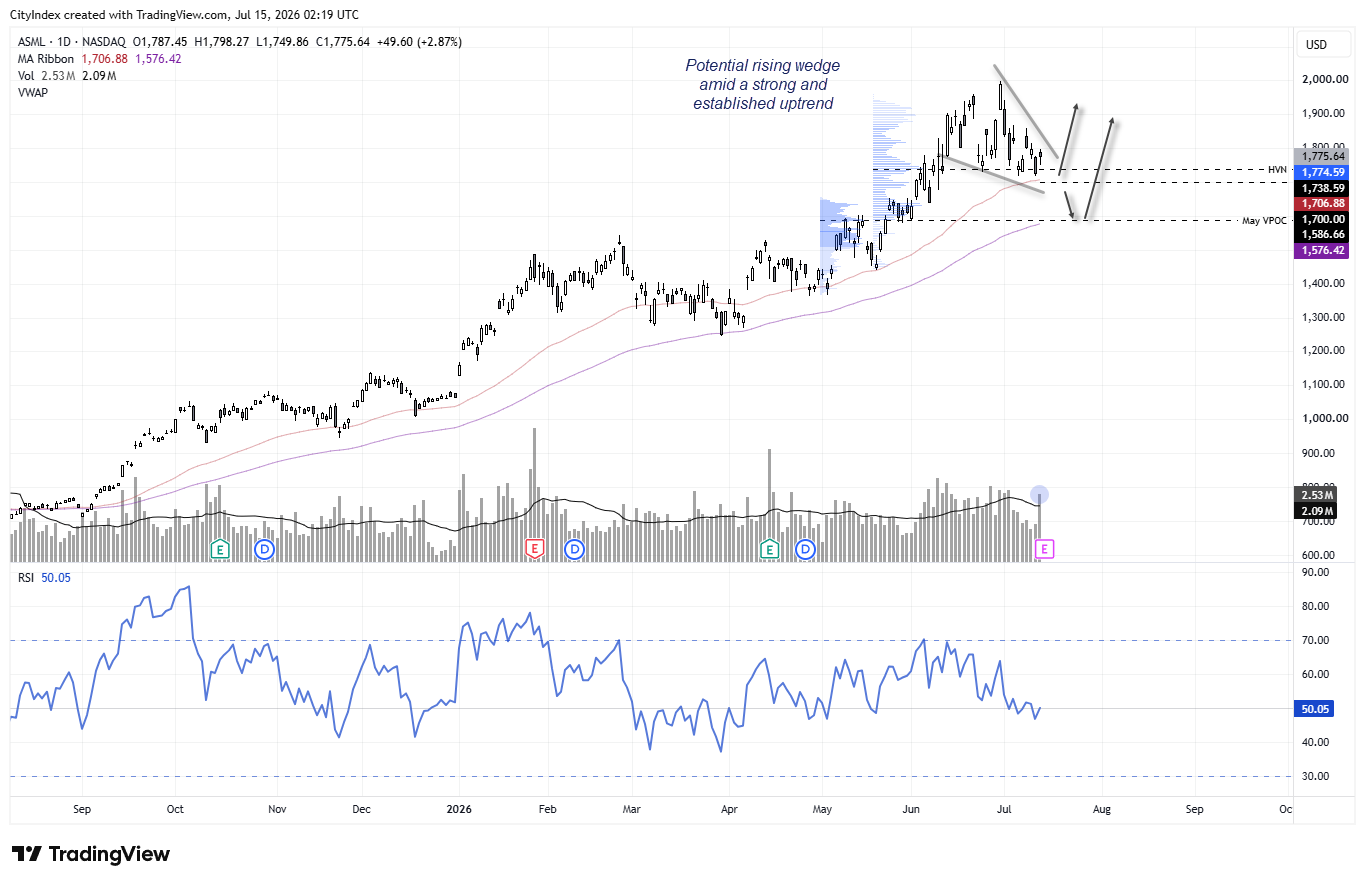
Source: NASDAQ, TradingView
- A disappointing earnings report could trigger a gap lower, with a break beneath 1,700 exposing the 100-day EMA and May's volume point of control (VPOC) around 1,580.
- Even if prices initially move lower, the broader daily uptrend remains well established, suggesting bargain hunters may be waiting to buy any meaningful dip.
- If ASML can hold above 1,700 over the near term, a move back towards 1,900 remains possible. A break above that level would bring the 2,000 milestone into focus.


Nasdaq 100 Futures (NQ) Technical Analysis
The daily chart shows Nasdaq 100 futures (NQ) coiling within a tight triangle. While this suggests volatility may be just around the corner, traders should also be alert to false breakouts and fickle price action during the quieter summer months on Wall Street. Declining trading volumes also point to lower participation in the futures market, increasing the risk of choppy moves.
While much of the near-term outlook may hinge on ASML's earnings report, I have an inkling. I have also highlighted key support and resistance zones where bulls and bears may look for reversal signals or breakout confirmation.
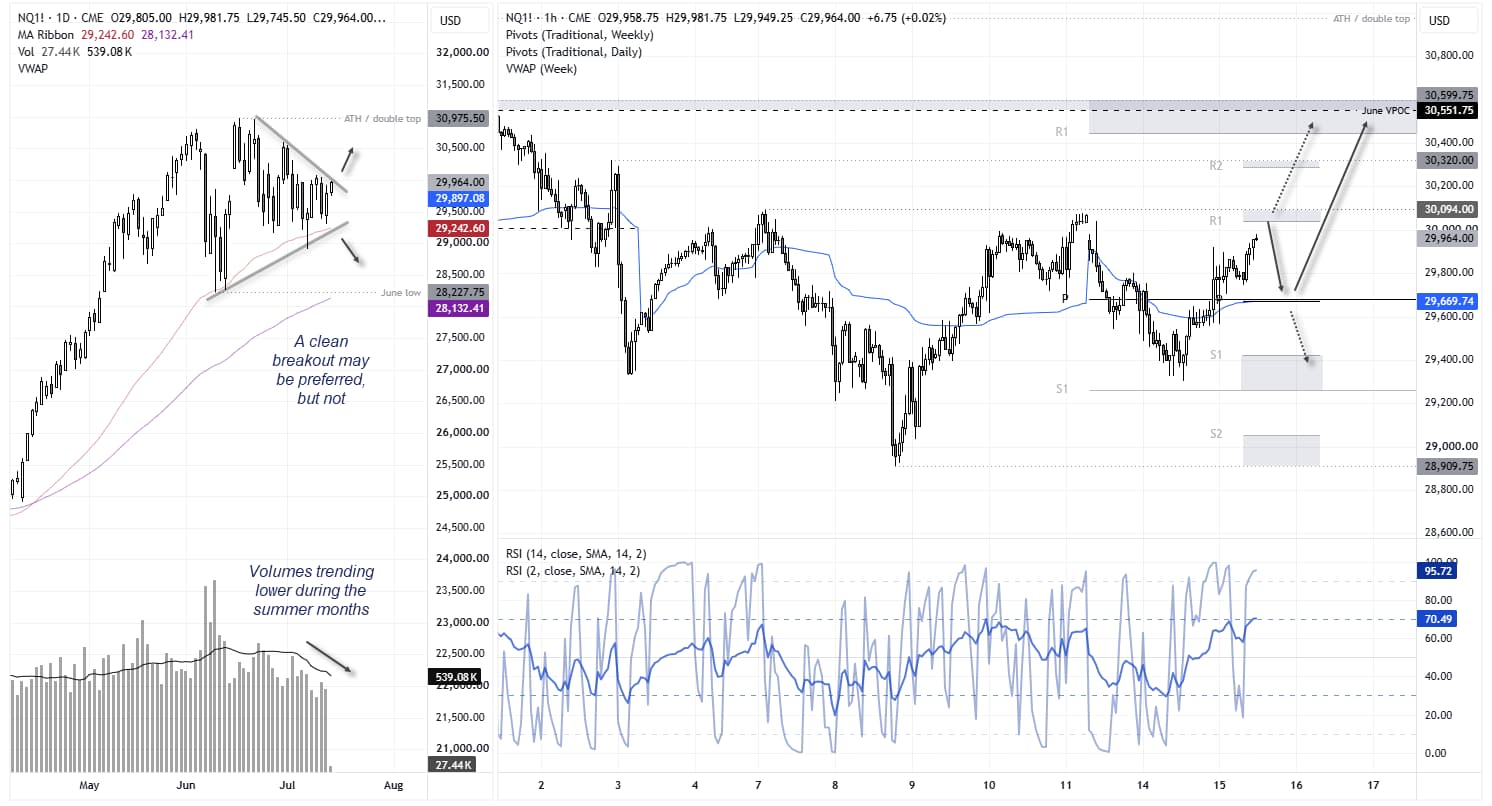
Source: CME, TradingView
View the full economic calendar
View the full economic calendar
-- Written by Matt Simpson
Follow Matt on Twitter @cLeverEdge
How to trade with City Index
You can trade with City Index by following these four easy steps:
- Open an account, or log in if you’re already a customer
• Open an account in the UK
• Open an account in Australia
• Open an account in Singapore
- Search for the market you want to trade in our award-winning platform
- Choose your position and size, and your stop and limit levels
- Place the trade
Latest market news




The complete CFD trading experience
Award-winning platforms, competitive spreads, low commissions and dedicated support.
We live and breathe the markets and are dedicated to helping traders realise their ambitions as we continue to set the industry bar.
Economic calendar
Web Trader platform
Our sophisticated web-based platform is packed with features.
Related articles
S&P 500, Nasdaq, Dow Forecast: Nasdaq Selloff Deepens as Dow Rally Stalls 10 24 2026
A failed S&P breakout and looming Nasdaq support test raise the stakes for next week’s Fed decision and October’s monthly close.


Nasdaq 100 Forecast: NDX Falls as the tech rout continues and oil prices soar
U.S. stocks are pointing to a modestly lower open after a sharp AI sell-off yesterday, as telecom stocks slide. Brent rises towards $115 adding to inflation pressures ahead of the FOMC rate decision.


Nasdaq 100 Slides as Meta Posts Strong Results and Drops 6%
The Nasdaq 100 sell-off is being driven by doubts over AI spending, as investors punish strong earnings that fail to justify stretched valuations.
StoneX Europe Ltd may make third party material available on this website which may contain information included but not limited to the conditions of financial markets. The material is for information purposes only and does not contain, and should not be construed as containing, investment advice and/or investment recommendation and/or an investment research and/or an offer of or solicitation for any transactions in financial instruments; any decision to enter into a specific transaction shall be made by the client following an assessment by him/her of their situation.
StoneX Europe Ltd makes no representation or warranty and assumes no liability as to the accuracy or completeness of the information provided, nor any loss arising from any investment based on a recommendation, forecast or other information supplied. You should always seek independent advice as to your suitability to speculate in any related markets and your ability to assume the associated risks, if you are at all unsure. We are not under any obligation to update any such material. Any opinion made may be personal to the author and may not reflect the opinion of StoneX Europe Ltd.