




NZD/USD: Kiwi slips as oil spike, tech breakdown deepen slide
A souring global backdrop and surging crude have combined to put the squeeze on the New Zealand dollar. With key technical levels giving way and momentum turning bearish, near-term risks remain skewed to the downside.
Share this:

- Kiwi tracking crude, not China or copper
- Channel and 50DMA support both broken
- .5900 test on radar; .5850 next if it fails
NZD/USD Summary
As a small, open economy closely tied to global growth, it’s no surprise the New Zealand dollar is struggling in the current environment, weighed down by trade war uncertainty and heightened geopolitical tensions in the Middle East. As a net energy importer, it's exposed to abrupt price spikes and supply disruptions. Throw in a technical breakdown that explains much of the recent decline in NZD/USD, and it’s looking increasingly likely the near-term highs are in for the Kiwi.
Kiwi Hindered by Crude Price Spike
Source: TradingView
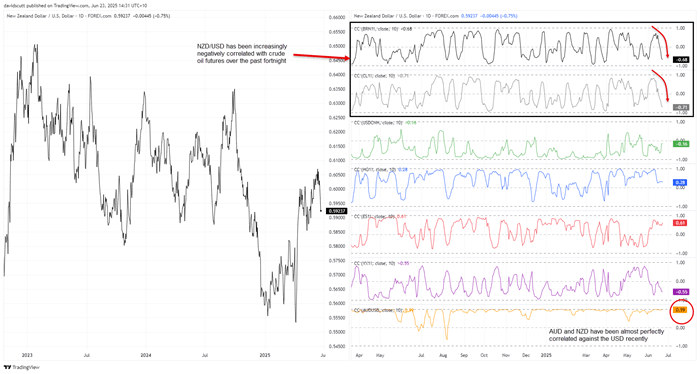
Before diving into the NZD/USD technical picture, New Zealand’s status as a net importer of petroleum products seems to be working against the Kiwi, with the currency increasingly negatively correlated with both Brent and WTI crude futures over the past fortnight. In contrast, its relationships with traditional drivers like the Chinese yuan, broader risk sentiment (as proxied by S&P 500 futures), and cyclical assets like copper have either weakened or disappeared altogether.
Given the similar economic make-up and fuel security dynamics, its 0.99 correlation with AUD/USD suggests traders may want to keep an eye on crude oil futures for directional cues on the Kiwi.
NZD/USD Bearish Break Sparks Accelerated Selling
Source: Trading View
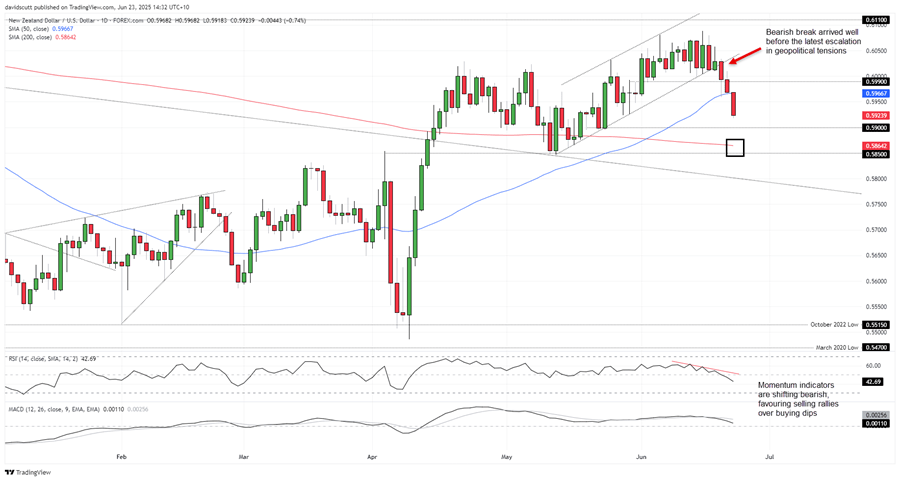
But it’s not just geopolitics creating headwinds. Technicals are clearly playing a role in the latest unwind. As flagged previously, the break of channel support midway through last the week proved to be a turning point, with losses accelerating even before the escalation in geopolitical tensions.
A break of minor support at .5990 saw NZD/USD resting on the 50-day moving average into the weekend. With risk appetite souring earlier Monday, that level has now given way, sparking a fresh wave of selling. Having already taken out the May 28 low at .5925, bears will be eyeing a move toward support at .5900. If that level breaks, the focus shifts to the 200-day moving average and horizontal support at .5850.
Momentum indicators are also turning bearish. RSI (14) is below 50 and trending lower, while MACD has crossed beneath the signal line and is closing in on a move below zero.
However, the pair has already fallen a long way fast, so chasing shorts down here doesn’t look like a high-probability play. The preference would be to wait for a clean break of .5900 or a bounce toward the 50-day moving average, allowing for stops to be placed above either level to guard against a reversal.
Related tags:
Latest market news




The complete CFD trading experience
Award-winning platforms, competitive spreads, low commissions and dedicated support.
We live and breathe the markets and are dedicated to helping traders realise their ambitions as we continue to set the industry bar.
Economic calendar
Web Trader platform
Our sophisticated web-based platform is packed with features.
Related articles

NZD/USD reversal case strengthens as Fed pricing cools
NZD/USD has triggered a bullish reversal after a punishing two-month decline, with less hawkish Fed pricing and an aggressive RBNZ rates path providing fuel for a rebound.

NZD/USD pressure mounts as payrolls looms large
NZD/USD has fallen sharply as Fed rate expectations reset higher, but extreme downside stretch and major support raise the risk of a violent counter-trend rebound.

NZD/USD: US yield advantage keeps pressure on the Kiwi
NZD/USD has become unusually sensitive to relative front-end rates, with the US two-year yield advantage now near historically extreme levels.
StoneX Europe Ltd may make third party material available on this website which may contain information included but not limited to the conditions of financial markets. The material is for information purposes only and does not contain, and should not be construed as containing, investment advice and/or investment recommendation and/or an investment research and/or an offer of or solicitation for any transactions in financial instruments; any decision to enter into a specific transaction shall be made by the client following an assessment by him/her of their situation.
StoneX Europe Ltd makes no representation or warranty and assumes no liability as to the accuracy or completeness of the information provided, nor any loss arising from any investment based on a recommendation, forecast or other information supplied. You should always seek independent advice as to your suitability to speculate in any related markets and your ability to assume the associated risks, if you are at all unsure. We are not under any obligation to update any such material. Any opinion made may be personal to the author and may not reflect the opinion of StoneX Europe Ltd.