




NZD/USD: Kiwi hit hard by risk aversion despite Q1 GDP pop
New Zealand’s economy outperformed in Q1, but you wouldn’t know it from the Kiwi’s reaction. NZD/USD broke sharply lower Thursday as geopolitical nerves saw risk appetite crater, triggering a bearish technical break that may have further to run.
Share this:

NZD/USD Summary
The New Zealand economy may have started 2025 with a bang, but that wasn’t enough to support the Kiwi dollar on Thursday with the pair sinking to multi-week lows as risk aversion returned. Having taken out some key downside levels, there’s scope for the move to extend further—especially if risk appetite were to sour.
Strong Growth is Yesterday’s News
New Zealand’s economy grew 0.8% in Q1, comfortably ahead of the RBNZ’s 0.4% forecast, with strength concentrated in goods production. Despite the quarterly pop, annual GDP was still down 1.1%, a reminder that broader conditions remain fragile.
Manufacturing rebounded 2.4%, helped by transport equipment and machinery, while business services also rose 2.4% thanks to a lift in IT-related activity. Healthcare chipped in with another solid quarter, up 1.4%. The bounce in goods-producing industries—up 1.3% after a sharp fall in Q4—was a key driver behind the upside surprise. The services side—the largest sector accounting for 73.6% of GDP—was softer, rising 0.4% overall.
Despite topping market and RBNZ expectations, the data was rightly treated by traders as something akin to a historic document with little relevance to today.
NZD/USD Breaks Down
Source: TradingView
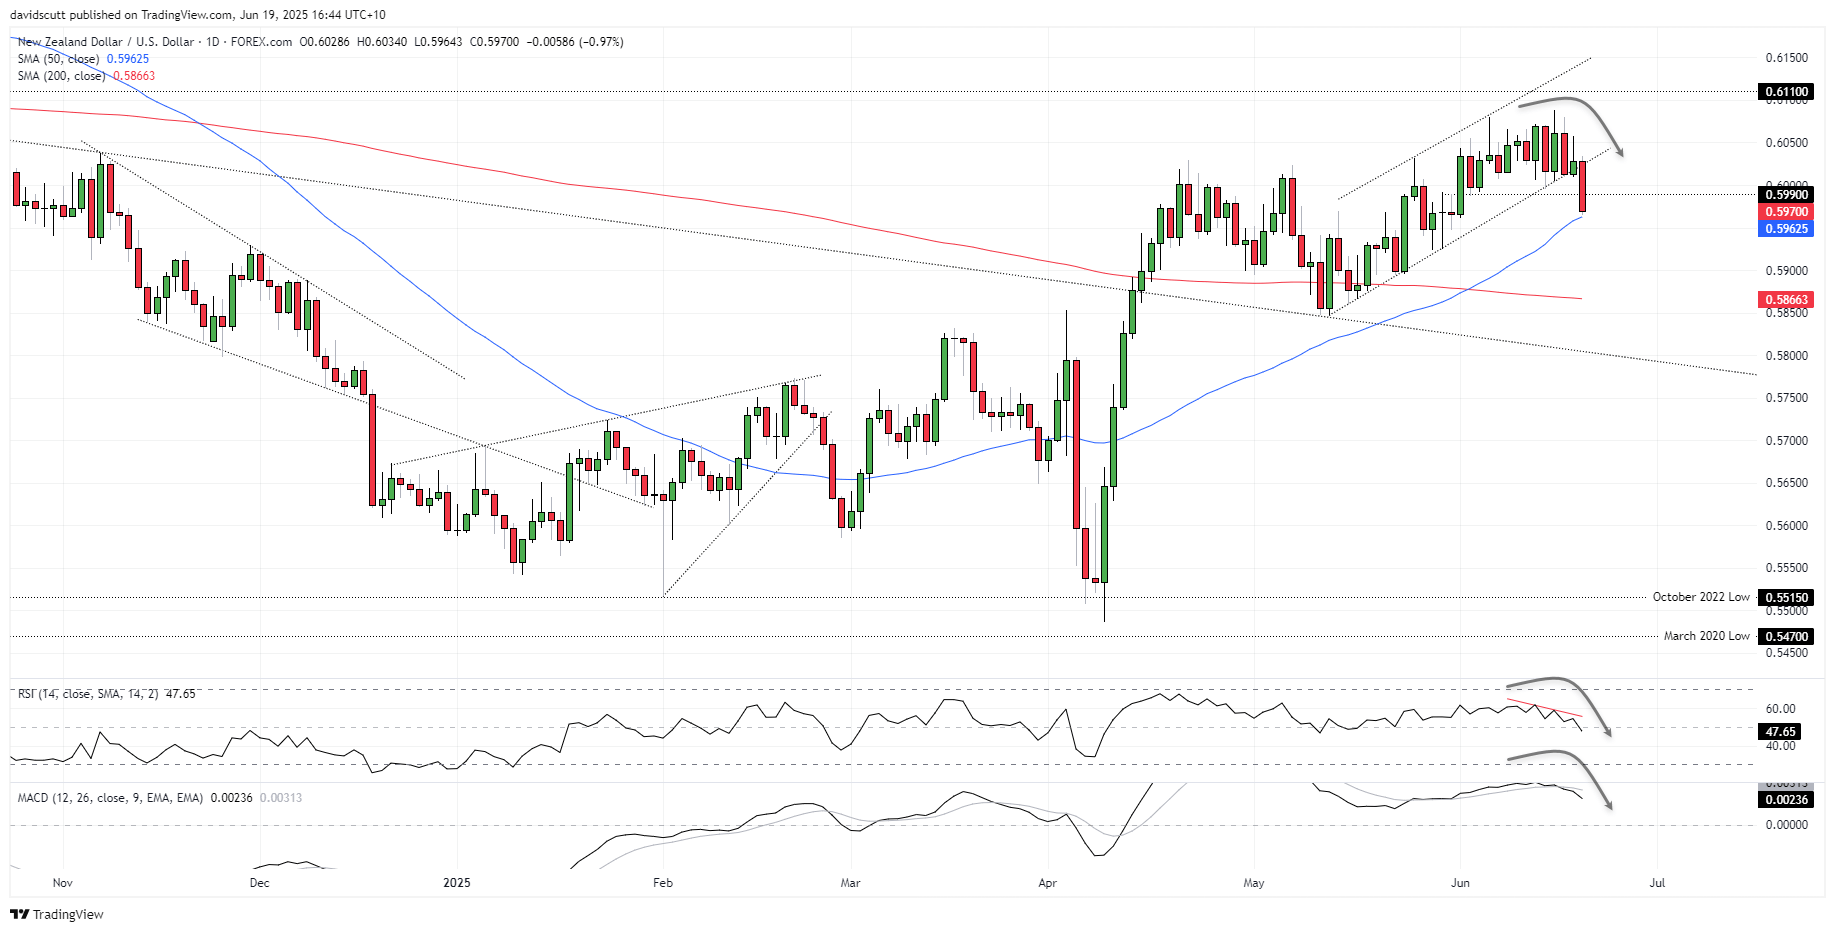
Downside risks for NZD/USD flagged earlier in the week have materialised, with the price tumbling to levels not seen since early June. Rather than being Kiwi-specific, the move was sparked by a Bloomberg headline stating the U.S. was readying for a possible attack on Iran in the “coming days.” It was enough to see NZD/USD break channel support it had been testing for several days beforehand, overwhelming buyers who had been lurking beneath .6000.
RSI (14) is trending lower and below 50. MACD remains above zero but has already crossed the signal line and is keeling over, adding to the sense that while not yet outright bearish, the momentum picture is shifting in that direction.
Downside levels to watch include the 50-day moving average, .5925—where the Kiwi bounced from in late May—along with .5900 and the important 200-day moving average. Having previously acted as support, .5990 may now revert to resistance if the bearish break were to reverse.
-- Written by David Scutt
Follow David on Twitter @scutty
How to trade with City Index
You can trade with City Index by following these four easy steps:
- Open an account, or log in if you’re already a customer
• Open an account in the UK
• Open an account in Australia
• Open an account in Singapore
- Search for the market you want to trade in our award-winning platform
- Choose your position and size, and your stop and limit levels
- Place the trade
Related tags:
Latest market news




The complete CFD trading experience
Award-winning platforms, competitive spreads, low commissions and dedicated support.
We live and breathe the markets and are dedicated to helping traders realise their ambitions as we continue to set the industry bar.
Economic calendar
Web Trader platform
Our sophisticated web-based platform is packed with features.
Related articles
USD/JPY Weekly Outlook: Volatility Has Left the Building
The yen has ignored broad dollar weakness, falling Treasury yields and renewed market turbulence. Yet its relationship with US interest rates remains intact. So why is USD/JPY going absolutely nowhere fast?
Swiss Franc Forecast: USD/CHF Seven-Week Rally Reverses From Yearly Highs 10 16 2026
A sharp rejection from fresh highs has shifted momentum in favor of USD/CHF bears, raising the stakes for a critical support test.


Nasdaq 100 forecast: Tech stocks not out of woods yet
US index futures pushed higher in the first half of Friday’s session, taking cues from a strong performance from European equities. Both European and US equity futures extending yesterday’s impressive recovery after the sharp sell-off earlier in the week. But the lingering concerns around the AI investment cycle remain, while bond markets were easing lower again, lifting yields.

StoneX Europe Ltd may make third party material available on this website which may contain information included but not limited to the conditions of financial markets. The material is for information purposes only and does not contain, and should not be construed as containing, investment advice and/or investment recommendation and/or an investment research and/or an offer of or solicitation for any transactions in financial instruments; any decision to enter into a specific transaction shall be made by the client following an assessment by him/her of their situation.
StoneX Europe Ltd makes no representation or warranty and assumes no liability as to the accuracy or completeness of the information provided, nor any loss arising from any investment based on a recommendation, forecast or other information supplied. You should always seek independent advice as to your suitability to speculate in any related markets and your ability to assume the associated risks, if you are at all unsure. We are not under any obligation to update any such material. Any opinion made may be personal to the author and may not reflect the opinion of StoneX Europe Ltd.