





NZD/USD Outlook: New Zealand Dollar Weakens Ahead of RBNZ Decision
The NZD/USD pair has fallen more than 1% over the past four trading sessions, favoring the U.S. dollar over the New Zealand dollar. For now, the bearish bias remains intact as the market awaits the Reserve Bank of New Zealand’s (RBNZ) interest rate decision.
Share this:

The NZD/USD pair has fallen more than 1% over the past four trading sessions, favoring the U.S. dollar over the New Zealand dollar. For now, the bearish bias remains intact as the market awaits the Reserve Bank of New Zealand’s (RBNZ) interest rate decision, amid continued uncertainty surrounding the Federal Reserve’s next moves. If New Zealand confirms a rate cut, selling pressure on the pair could intensify in the short term.
RBNZ Decision Day Arrives
Today, the RBNZ is expected to announce its next monetary policy decision, and current consensus points to a 25-basis point cut, bringing the rate from 3.25% down to 3.00%. Markets believe the central bank views inflation as under control, with the most recent annual figure at 2.7%, comfortably below the 3% upper limit of its inflation target. Signs of labor market weakness have also emerged, reinforcing the case for starting a new rate-cutting cycle, likely holding the rate at 3.00% in the short term.
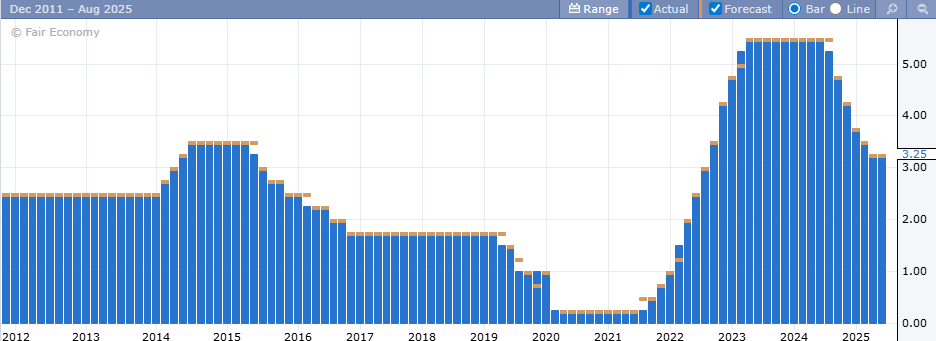
Source: ForexFactory
In this environment, pressure on the New Zealand dollar has started to build. A lower interest rate reduces the country’s investment appeal, particularly for fixed-income instruments, and could lead to capital outflows toward economies with higher yields, weakening demand for the NZD. If the RBNZ confirms a dovish tone and signals further cuts ahead, downward pressure on NZD/USD is likely to persist in the coming sessions.
What About the U.S.?
The situation at the Federal Reserve is becoming increasingly similar. Market participants are raising the probability that the Fed will also begin a rate-cutting cycle. According to data from CME Group, there is currently an 83.1% chance of a rate cut from 4.5% to 4.25% at the next September 17 meeting, which would align with the stance expected from the RBNZ.
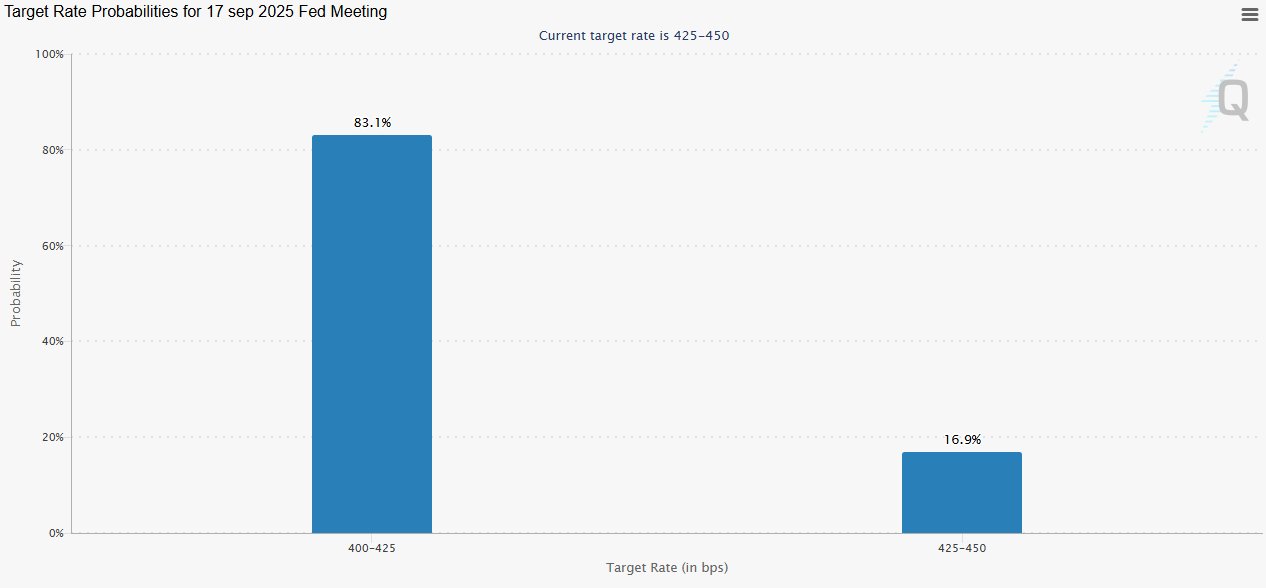
Source: CMEGroup
However, the market remains more focused on the current interest rate differential, as the U.S. rate (4.5%) is still significantly higher than that of New Zealand (potentially 3.0%). Additionally, the Jackson Hole Symposium takes place this week, and key remarks from the Fed are expected. These could clarify whether the Fed is truly ready to begin cutting rates soon, or if it prefers a more cautious approach.
For now, this rate differential and the uncertainty around U.S. monetary policy continue to favor the U.S. dollar, which also offers more attractive returns on its dollar-denominated securities. This dynamic has increased demand for the greenback and may continue to put downward pressure on NZD/USD, especially if the Fed maintains a less dovish stance than the RBNZ.
NZD/USD Technical Outlook
Source: StoneX, Tradingview
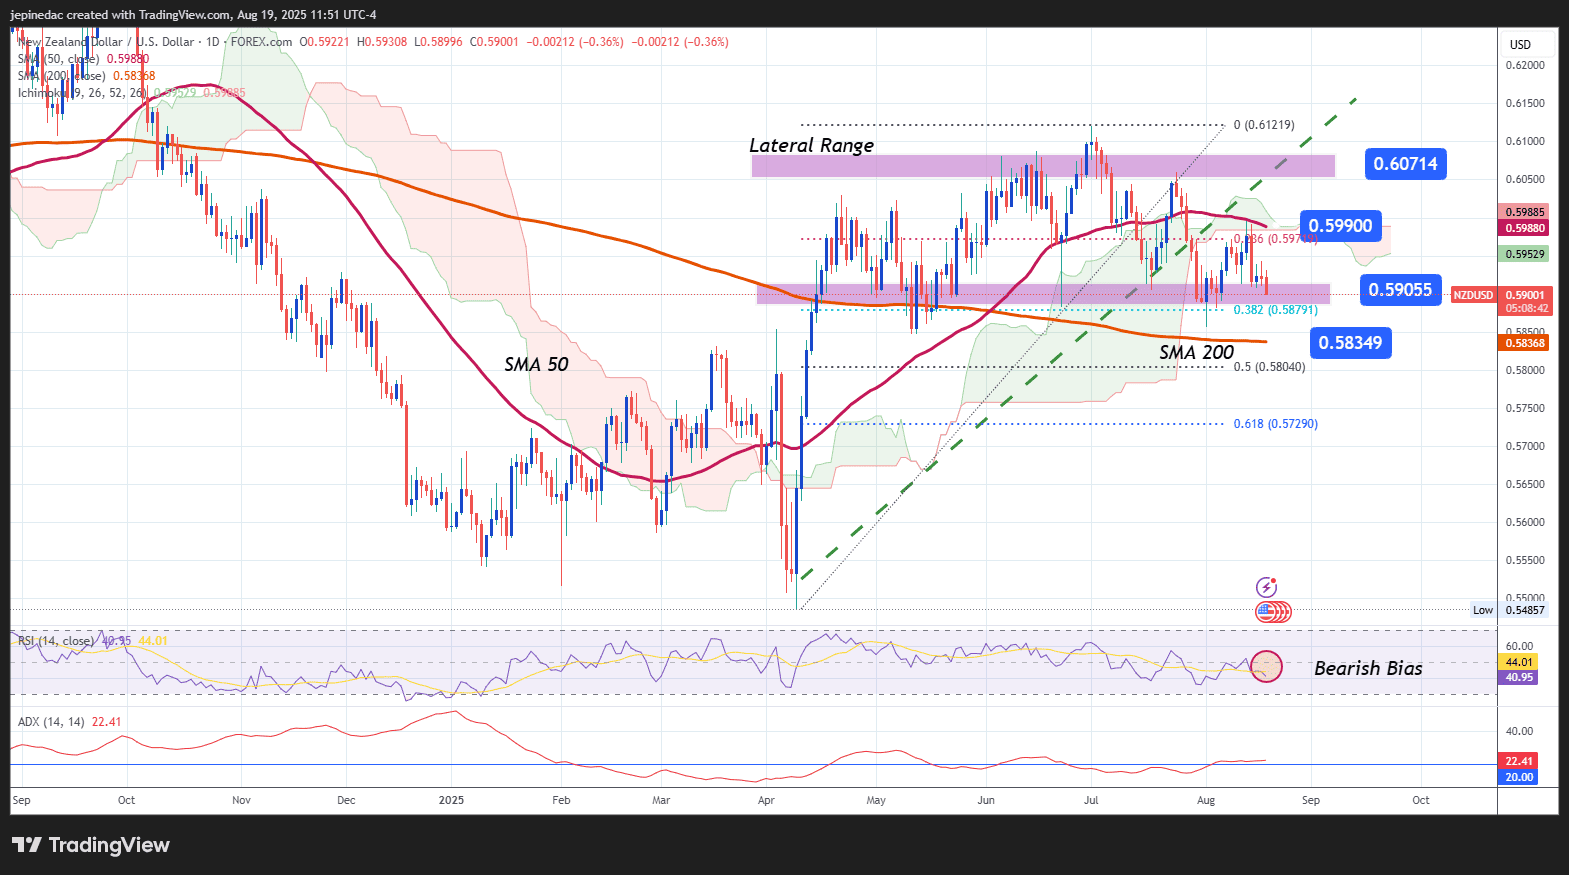
- Consolidated Sideways Channel: Since late April, the NZD/USD pair has traded within a well-defined lateral channel, with resistance around 0.60714 and support at 0.59055. So far, bearish swings have not been strong enough to break below the channel’s base, keeping this structure as the main technical reference for the coming sessions. However, if selling pressure continues to build, a breakdown of the channel could signal the start of a new bearish trend.
- RSI: The Relative Strength Index has begun fluctuating consistently below the 50 level, indicating that bearish momentum is gaining ground. If this persists, the downward bias could strengthen in the short term.
- ADX: The ADX line remains above the neutral level of 20, suggesting active volatility, though without a clearly dominant direction yet. As the RBNZ decision approaches, volatility may increase, and the indicator could reflect stronger directional movement if a channel break is confirmed.
Key Levels:
- 0.59900 – Key Resistance: Located at the midpoint of the channel, this level also aligns with the Ichimoku cloud and the 50-period moving average. Price action near this zone could keep the pair within its current range.
- 0.59055 – Immediate Support: This marks the bottom of the channel and coincides with the 38.2% Fibonacci retracement. A bearish breakout here could trigger a stronger selling bias in the short term.
- 0.58349 – Major Support: Aligned with the 200-period simple moving average, this is the most critical technical barrier in the event of a breakdown. If price moves below this level, it could confirm a structural shift, opening the door to a sustained downtrend.
Written by Julian Pineda, CFA – Market Analyst
Follow him on: @julianpineda25
Related tags:


The complete CFD trading experience
Award-winning platforms, competitive spreads, low commissions and dedicated support.
We live and breathe the markets and are dedicated to helping traders realise their ambitions as we continue to set the industry bar.
Economic calendar
Web Trader platform
Our sophisticated web-based platform is packed with features.
Related articles

USD/CAD shooting star puts September surge on notice
USD/CAD has printed a clear bearish reversal pattern after an extraordinary September surge, but confirmation may depend heavily on how US Treasury yields react to Friday’s payrolls report.


USD/MXN Analysis: Is Super Peso Starting to Fade?
Over recent trading sessions, the Mexican peso has continued to show signs of weakness against the U.S. dollar. This can already be seen in USD/MXN, which has gained more than 1.7% over the last three sessions, highlighting sustained buying pressure in favor of the dollar in the short term.

Canadian Dollar Analysis: USD/CAD Returns to July Highs Ahead of NFP
The Canadian dollar continues to face one of its most challenging environments in recent months when it comes to maintaining strength against the U.S. dollar. The weakness of the Canadian currency is clearly reflected in USD/CAD, which has now recorded nine consecutive bullish sessions and gained more than 1.7% during that period.
StoneX Europe Ltd may make third party material available on this website which may contain information included but not limited to the conditions of financial markets. The material is for information purposes only and does not contain, and should not be construed as containing, investment advice and/or investment recommendation and/or an investment research and/or an offer of or solicitation for any transactions in financial instruments; any decision to enter into a specific transaction shall be made by the client following an assessment by him/her of their situation.
StoneX Europe Ltd makes no representation or warranty and assumes no liability as to the accuracy or completeness of the information provided, nor any loss arising from any investment based on a recommendation, forecast or other information supplied. You should always seek independent advice as to your suitability to speculate in any related markets and your ability to assume the associated risks, if you are at all unsure. We are not under any obligation to update any such material. Any opinion made may be personal to the author and may not reflect the opinion of StoneX Europe Ltd.