





S&P 500 analysis: Technical Tuesday - March 25, 2025
After a bright start, the S&P 500 and Nasdaq 100 were coming off their highs, while the Dow and Russell lost their earlier gains. The loss of momentum comes after the S&P enjoyed one of its strongest days so far this year in the previous session. Clearly, investors are fearful about further volatility ahead and are happy to book profit, as the major indices test key resistance areas.
Share this:

S&P 500 analysis: After a bright start, the S&P 500 and Nasdaq 100 were coming off their highs, while the Dow and Russell lost their earlier gains. The loss of momentum comes after the S&P enjoyed one of its strongest days so far this year in the previous session. Clearly, investors are fearful about further volatility ahead and are happy to book profit, as the major indices test key resistance areas. With consumer and business sentiment sinking, as Trump’s tariffs fuel inflation worries, dampen demand, and heighten recession risks, you can understand why.
Sentiment remains cagey
There are fears that the rebound may have run a bit too high given ongoing trade war risks, signs of economic slowdown, and sticky inflation. Today, we saw the CB consumer confidence slumped to a four-year low, tempering optimism over a potential end of the conflict in Ukraine, where Russia and Ukraine have agreed to truce in the Black Sea. Clearly some investors remain unconvinced that the worst is over and are happy to book profit after a decent rally in recent days.
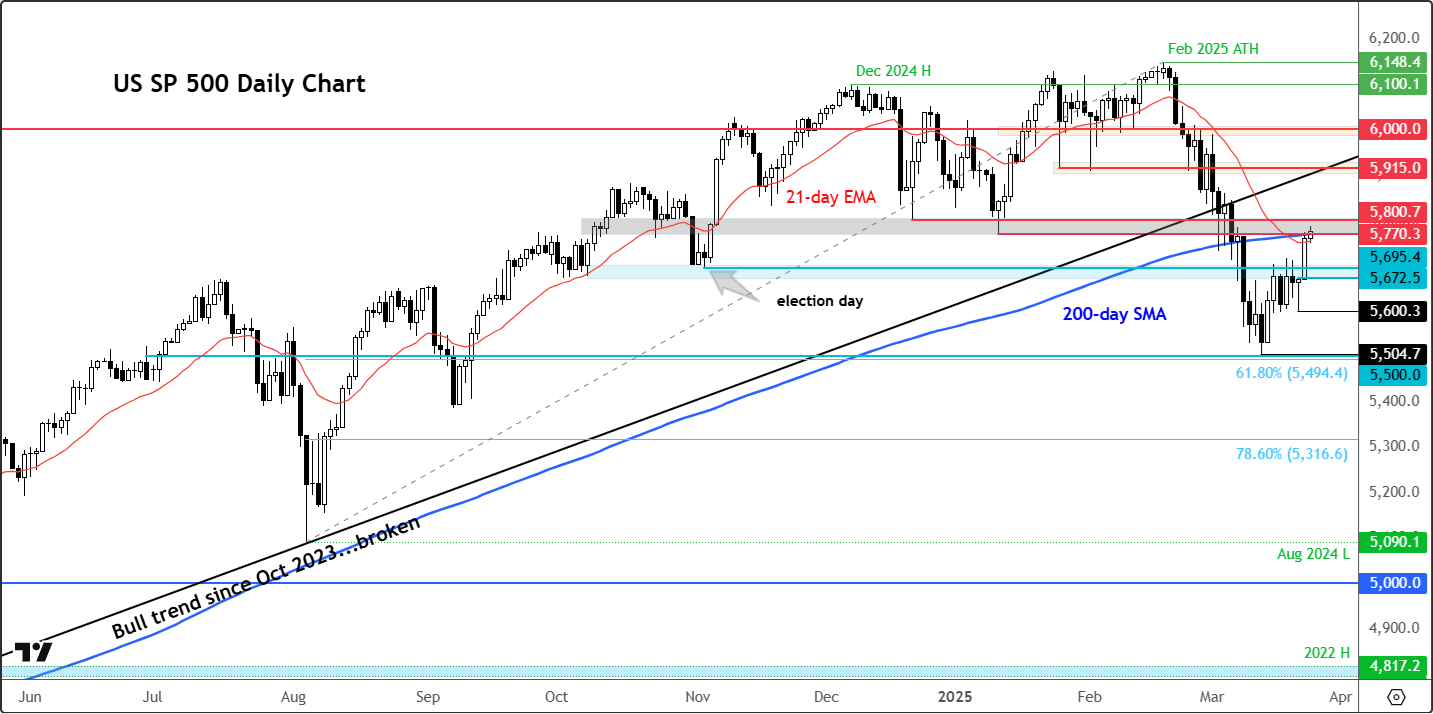
S&P 500 analysis: key resistance levels to watch after recent rally
Source: TradingView.com
The S&P 500 has been on a strong two-week rally, but now finds itself at a critical resistance zone. The index is currently testing resistance around the 200-day moving average and a prior support level in the 5770-5800 region. This key area, shaded in grey on the chart, could determine whether the recent bullish momentum continues.
Key support levels to watch
Support for the index comes in between 5672 and 5695, an area shaded in blue on the chart. This zone is also significant because it marked the beginning of the post-election rally (which eventually faltered). While the fact the index has reclaimed this level is a bullish sign, the S&P 500 must remain above this range for the rest of the week to sustain the upward bias.
However, if the support at 5672-5695 fails, the bulls could face significant challenges. A breakdown here might increase the risk of renewed selling pressure, similar to what was seen a few weeks ago. The situation could worsen if the index goes on to drop below 5600, marking Friday’s low when a hammer candle was formed.
Downside and upside scenarios
If the 5600 level breaks, the S&P 500 could decline further to retest the 5500 area, which aligns with the 61.8% Fibonacci retracement level of the August-February rally. This would represent a critical test for the broader market.
On the upside, if resistance in the 5770-5800 range is broken, the index could see further gains toward the underside of the broken trendline and the next resistance level around 5915. A breakout here would reinforce the bullish case and potentially lead to a more extended rally.
In a nutshell
The S&P 500 is at a pivotal technical juncture, with support at 5672-5695 and resistance at 5770-5800 defining the near-term outlook. Traders should closely monitor these levels to gauge the next move. A break above resistance could trigger a continuation higher, while a loss of key support might put bulls under pressure and open the door for further declines.
-- Written by Fawad Razaqzada, Market Analyst
Follow Fawad on Twitter @Trader_F_R
How to trade with City Index
You can trade with City Index by following these four easy steps:
- Open an account, or log in if you’re already a customer
• Open an account in the UK
• Open an account in Australia
• Open an account in Singapore
- Search for the company you want to trade in our award-winning platform
- Choose your position and size, and your stop and limit levels
- Place the trade




The complete CFD trading experience
Award-winning platforms, competitive spreads, low commissions and dedicated support.
We live and breathe the markets and are dedicated to helping traders realise their ambitions as we continue to set the industry bar.
Economic calendar
Web Trader platform
Our sophisticated web-based platform is packed with features.
Related articles

Silver forecast: metals liquidation drags XAG/USD into $50-55 support
Silver has broken its July low and slipped into a long-term support zone as the selling in precious metals deepens. The chart shows where the metal could bottom, and next week's Fed decision may decide whether it does.

S&P 500 forecast: AI linked stocks remain under pressure
And just like that, it is Friday again and the end of a volatile week. Today offers little on the macro calendar to change the prevailing narrative, leaving markets largely at the mercy of risk appetite, oil prices and the growing unease around the AI trade.

Nasdaq 100 Slides as Meta Posts Strong Results and Drops 6%
The Nasdaq 100 sell-off is being driven by doubts over AI spending, as investors punish strong earnings that fail to justify stretched valuations.
StoneX Europe Ltd may make third party material available on this website which may contain information included but not limited to the conditions of financial markets. The material is for information purposes only and does not contain, and should not be construed as containing, investment advice and/or investment recommendation and/or an investment research and/or an offer of or solicitation for any transactions in financial instruments; any decision to enter into a specific transaction shall be made by the client following an assessment by him/her of their situation.
StoneX Europe Ltd makes no representation or warranty and assumes no liability as to the accuracy or completeness of the information provided, nor any loss arising from any investment based on a recommendation, forecast or other information supplied. You should always seek independent advice as to your suitability to speculate in any related markets and your ability to assume the associated risks, if you are at all unsure. We are not under any obligation to update any such material. Any opinion made may be personal to the author and may not reflect the opinion of StoneX Europe Ltd.