



S&P 500 Analysis: Is SPX losing momentum near record highs?
As the trading week nears its end, one of the main short-term factors still standing out is the neutral tone in the S&P 500. The index has not been able to define a clear direction and, after falling close to -1.00% in the previous session, it is now attempting to recover with a gain of more than 0.7%.
Share this:

As the trading week nears its end, one of the main short-term factors still standing out is the neutral tone in the S&P 500. The index has not been able to define a clear direction and, after falling close to -1.00% in the previous session, it is now attempting to recover with a gain of more than 0.7%.
Still, rather than confirming a dominant buying bias, this move points to a phase of indecision around the index. If confidence remains affected by geopolitical and economic uncertainty, this dynamic could stay relevant over the coming trading sessions.


Short-term confidence moves into cautious territory
Economic and geopolitical events continue to weigh on confidence in risk assets such as SPX. In the Middle East, although there have been no major new military escalations, there is still no clear path toward a short-term peace agreement. Several rounds of negotiations may still be needed before a formal deal can be considered, keeping the outlook uncertain.
In addition, the new USTR tariff proposals under Section 301 have brought the possibility of additional 10% and even 12.5% tariffs on several countries back into focus. Although there is still no clear confirmation on how the process would move forward, the issue revives memories of 2025, when trade tensions created significant uncertainty for the global economy.
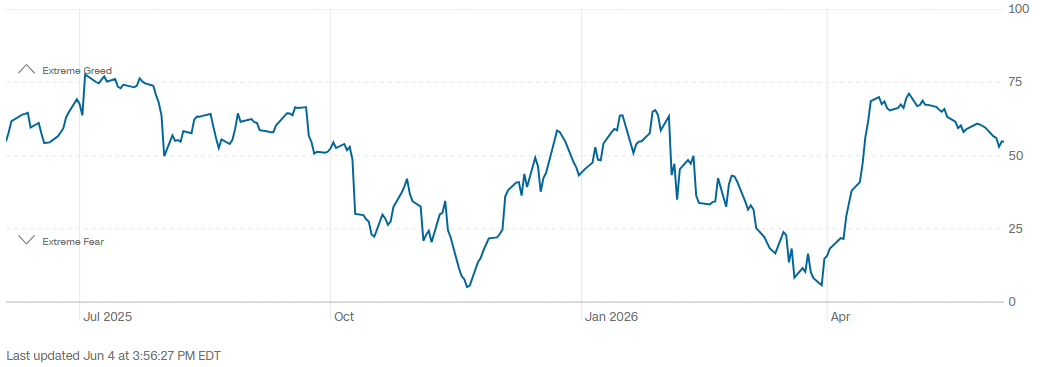
Both events keep short-term uncertainty alive. This is already visible in sentiment indicators, with the Fear and Greed Index holding near 55 points after moving down from “greed” territory into “neutral” territory. Rather than showing consistent optimism, the market is reflecting a more cautious stance, which makes it harder for risk appetite to gain clear traction in the short term.
Source: CNN
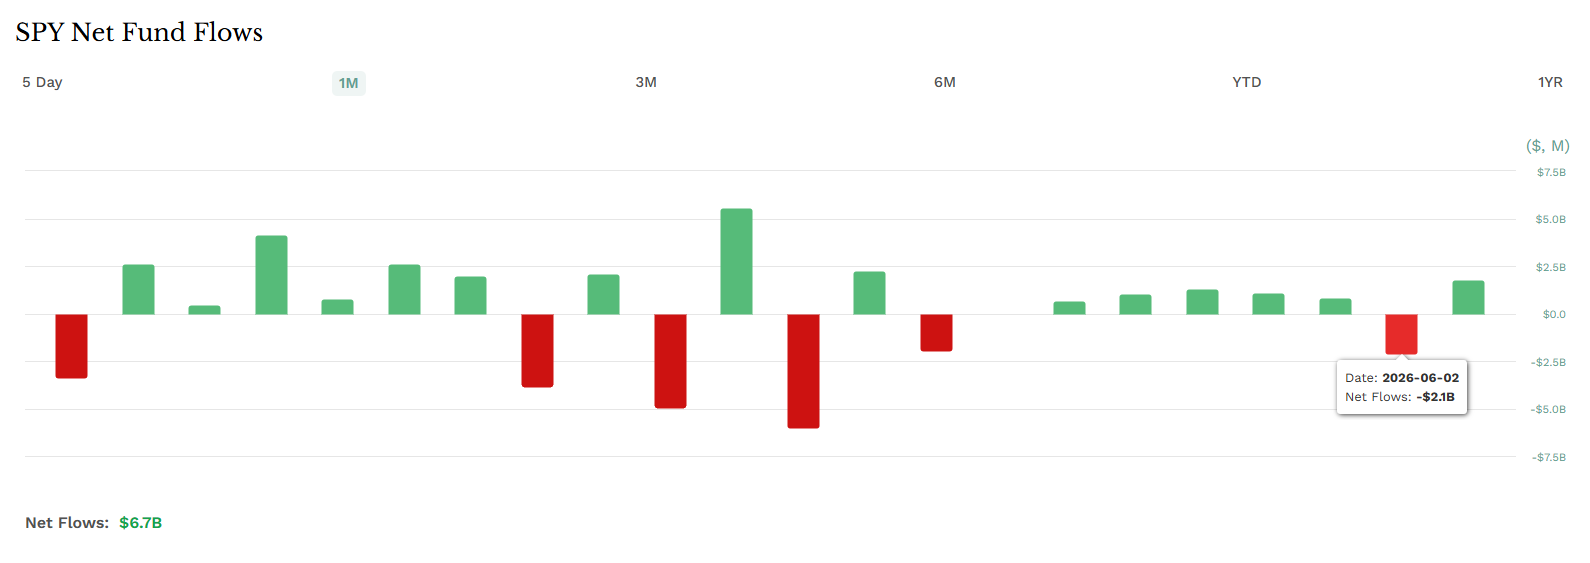
This moderation is also visible in flows for the SPDR S&P 500 ETF Trust (SPY). Since May 26, capital inflows have started to slow, and this week even saw an outflow of more than $2.1 billion. Alongside weaker confidence, this suggests demand activity within the S&P 500 has become more mixed and less stable in the short term.
Source: ETFCOM
Overall, the uncertainty still shaping market confidence may be making it harder for risk appetite to remain consistent. In this environment, demand for equity indices such as the S&P 500 could be losing traction, leaving room for a more relevant phase of indecision in the coming sessions.
Could the NFP release be relevant?
Tomorrow, the United States will publish the NFP employment report for May. The market currently expects 85,000 new jobs, compared with 115,000 jobs created in April. This release could generate two important readings for the market.
In the first scenario, if NFP comes in much stronger than expected, the effect could be counterproductive for the S&P 500. Although a solid labor market is usually seen as a positive signal for the economy, it could also strengthen expectations of a more aggressive Federal Reserve. That would increase the risk of higher US rates, reduce the available liquidity environment, and make consumer activity more difficult. In that case, conditions would not be ideal for consistent demand to return to the equity market, and a phase of neutrality or indecision could remain present in the SPX.
On the other hand, if the employment reading comes in close to expectations, it could create a calmer short-term environment. A moderate figure would show that the labor market remains stable without creating too many alarms for the central bank around additional inflation pressures. Under this scenario, buying pressure could regain relevance in the S&P 500 over the coming sessions.
Technical outlook for the S&P 500
Source: StoneX, Tradingview
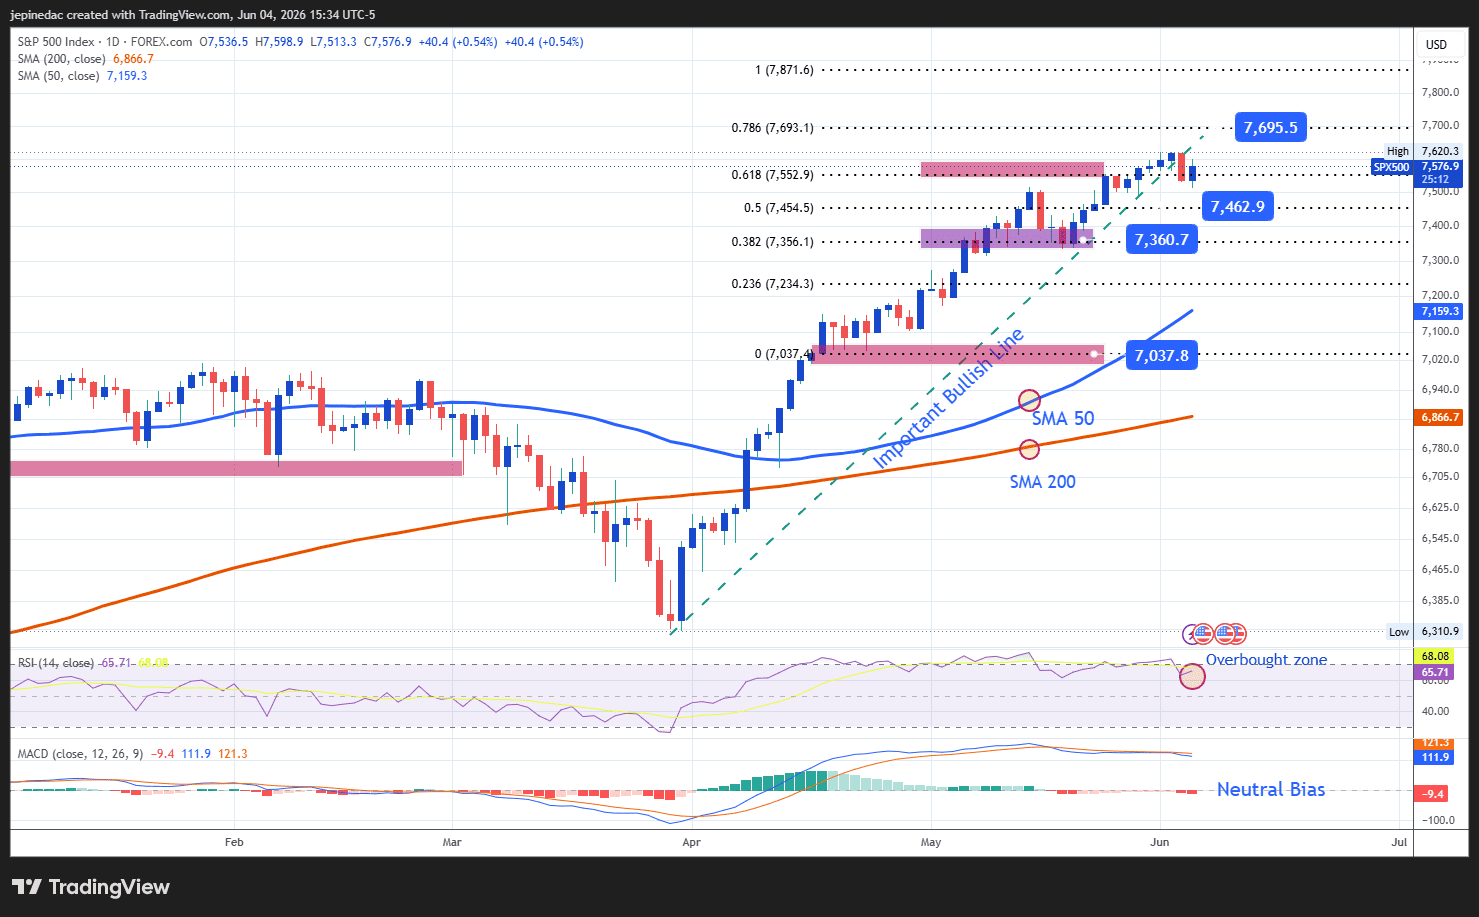
- Aggressive trendline begins to slow: Since the final days of March, the SPX has maintained a bullish trendline that remains the most relevant short-term technical structure. However, the recent neutral tone is starting to question the continuity of this formation. If buying pressure fails to regain traction, room could open for a sideways range in the coming sessions.
- MACD: At the moment, the MACD histogram remains very close to the 0 line, pointing to a balance in the strength of short-term moving averages. This behavior highlights a possible phase of neutrality in price action and, if it continues, could make indecision more relevant over the coming sessions.
- RSI: The RSI has started to pull back from overbought territory, marked by the 70 level. This suggests that buying momentum over the last 14 sessions is starting to lose traction. If the indicator fails to recover the bullish dynamic seen in previous weeks, it could warn of a more relevant phase of indecision.
Key levels:
- 7,700 points – Relevant resistance: With no historical references above current levels, this area stands as the most important psychological zone for bullish moves. It also aligns with the 78.6% Fibonacci trend-based extension. A move toward this level could restore short-term buying dominance and extend the aggressive bullish trendline over the coming weeks.
- 7,460 points – Near-term barrier: A recent retracement level that acts as the immediate support to watch. This area could serve as a tentative barrier if selling corrections begin to appear in the SPX over the coming sessions.
- 7,360 points – Key support: A relevant low area and one of the most important retracement zones of recent weeks. A move toward this level would not only break the current bullish structure but could also open the door to a more relevant selling bias on the daily chart over the medium term.
Written by Julian Pineda, CFA, CMT – Market Analyst
Follow him on: @julianpineda25
Latest market news




The complete CFD trading experience
Award-winning platforms, competitive spreads, low commissions and dedicated support.
We live and breathe the markets and are dedicated to helping traders realise their ambitions as we continue to set the industry bar.
Economic calendar
Web Trader platform
Our sophisticated web-based platform is packed with features.
Related articles

S&P 500 Forecast: SPX holds steady as tech stocks decline and banks rise post-earnings
U.S. stocks are mixed ahead of the open on Tuesday, with tech stocks leading the decline as investors also weigh bank earnings.


Indices weekly outlook: Can the DAX rebound turn into a reversal?
Global indices managed to bounce back towards the end of the week as risk mood improved following Thursday’s drop in bond yields and a slight decline in oil prices. But by late Friday afternoon, oil prices had made back most of Thursday’s drop and the bond markets remained under some pressure as European bourses closed for trading.


DAX, Gold and Bitcoin forecast: Dollar falls, yields retreat as risk appetite returns
Markets went from risk off to risk on yesterday afternoon and we have since kicked on with some follow-up buying of stocks, gold and silver, while the dollar has also shown signs of weakness. Risk appetite turned positive after bond yields and oil prices both retreated yesterday.
StoneX Europe Ltd may make third party material available on this website which may contain information included but not limited to the conditions of financial markets. The material is for information purposes only and does not contain, and should not be construed as containing, investment advice and/or investment recommendation and/or an investment research and/or an offer of or solicitation for any transactions in financial instruments; any decision to enter into a specific transaction shall be made by the client following an assessment by him/her of their situation.
StoneX Europe Ltd makes no representation or warranty and assumes no liability as to the accuracy or completeness of the information provided, nor any loss arising from any investment based on a recommendation, forecast or other information supplied. You should always seek independent advice as to your suitability to speculate in any related markets and your ability to assume the associated risks, if you are at all unsure. We are not under any obligation to update any such material. Any opinion made may be personal to the author and may not reflect the opinion of StoneX Europe Ltd.