





S&P 500 Forecast: The Index Continues to Reach New All-Time Highs
The current confidence prevailing in the U.S. stock market has allowed the S&P 500 to set a new all-time high at 6,130 points.
Share this:

The current confidence prevailing in the U.S. stock market has allowed the S&P 500 to set a new all-time high at 6,130 points. The index has recorded five consecutive days of growth, primarily driven by recent comments from Trump since his inauguration.
The President Keeps Driving the Market
Initially, comments about increased productivity and constant tax cuts for businesses encouraged investors to make purchases in the stock market. This had enabled the S&P 500 to maintain a bullish bias at the beginning of the week.
However, in his latest speech in Davos, Trump mentioned the possibility of imposing tariffs of 10% to 20% on certain European Union member countries, arguing that Europe’s trade policies have significantly harmed U.S. companies over the past four years.
Additionally, he urged OPEC to consistently lower oil prices to reduce global energy costs, thereby improving economic productivity, especially in the United States. He also highlighted the need for central banks to adopt a dovish stance, stating that he plans to push the Federal Reserve to support economic growth in anticipation of a potential reduction in energy costs, which are, in the long term, a key driver of inflation.
Trump’s comments have sustained confidence in the stock market toward the end of the week, thanks to the expectation of lower energy costs and the mild tariff discussions he is having with other countries (there are no material actions yet). However, if the tariffs start to materialize, this could be very detrimental to market confidence, as the harm to the United States' economic relations could also negatively impact expected economic growth. Until then, the market is fueling bullish confidence and supporting the current trend.
Stocks Maintain Confidence
Some companies within the S&P 500 have stood out and contributed to the current bullish pressure:
Netflix: Netflix has recorded remarkable growth of over 14% since Tuesday, with its stock nearing $1,000. Among its notable data, the company achieved a record 300 million subscribers and announced price increases in countries like Canada, the U.S., and Argentina, fueling an optimistic outlook among investors.
Palantir Technologies: This company has significantly contributed to the index with a 20% increase in its stock price since mid-January. After its inclusion in the S&P 500 in September 2024, it has shown volatility, but last year’s third-quarter results (revenue of $725 million versus the expected $700 million) have kept buying interest alive, pushing its stock near the $80 maximum.
Nvidia: The company with the highest weighting in the S&P 500 (6.99%) has benefited from recent White House comments about boosting the artificial intelligence sector. Its stock has risen more than 6% this week, reaching $150, consolidating its position as one of the strongest in the index and reinforcing the bullish bias in the stock market.
S&P 500 Technical Forecast
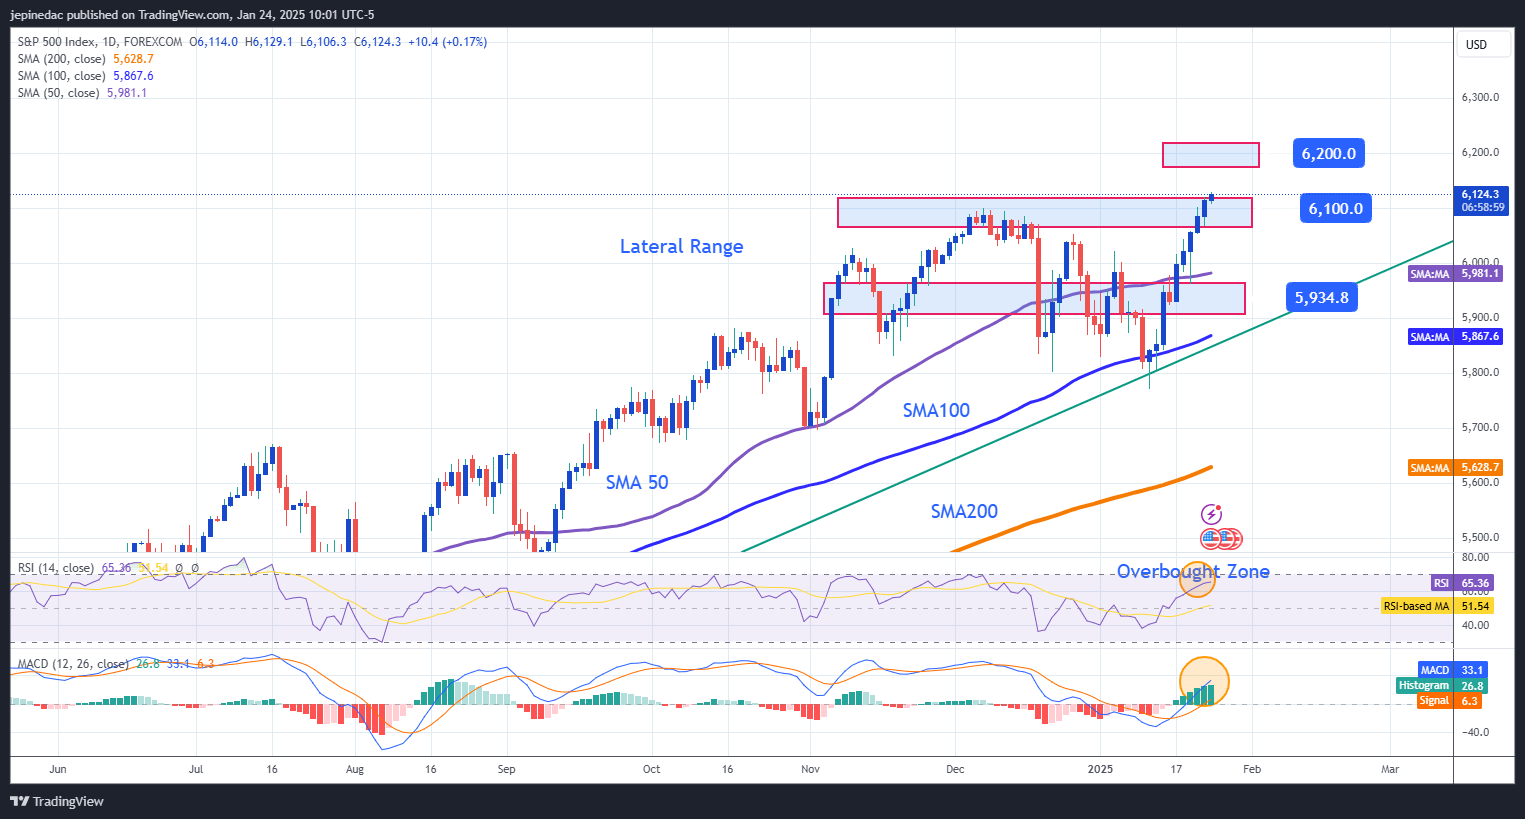
Source: StoneX, Tradingview
- Bullish Trend: The upward trend, maintained for several months, continues to show strong momentum. The simple moving averages of 50, 100, and 200 periods are aligned and show no signs of surprising crossovers in the short term, which reinforces the bullish direction.
However, in recent weeks, a small lateral range has formed, and the price is currently facing the upper barrier at 6,100 points, which could trigger some bearish corrections.
- RSI: The RSI line maintains a consistently positive slope. However, as the price advances strongly, it is approaching the overbought zone at 70. Oscillations near this level could suggest a short-term bearish correction.
- MACD: The MACD histogram oscillates above the neutral line at 0. As it moves further away from this line, it reinforces the short-term bullish oscillations, increasing current buying pressure.
Key Levels:
- 6,100: The current resistance level, located at recent all-time highs. Consistent oscillations above this level could break the lateral range and pave the way for the continuation of the bullish trend.
- 5,900: The nearest support level, corresponding to the lower part of the current lateral range and the 50-period moving average. Oscillations approaching this level could indicate a new bearish outlook in the short term.
Written by Julian Pineda, CFA – Market Analyst
Latest market news




The complete CFD trading experience
Award-winning platforms, competitive spreads, low commissions and dedicated support.
We live and breathe the markets and are dedicated to helping traders realise their ambitions as we continue to set the industry bar.
Economic calendar
Web Trader platform
Our sophisticated web-based platform is packed with features.
Related articles
US Midterm Fallout: What Does the “Blue Tsunami” Mean for the S&P 500?
Democrats made sweeping gains in the US midterm elections, winning control of both the House and Senate - what does it mean for the S&P 500 and the AI trade?


S&P 500 forecast: Democrats’ midterm victory rattled markets before dip buyers stepped in
Markets had a wild overnight session, with futures initially plunging before staging a sharp reversal and turning decisively higher. Global equity markets also bounced back, alongside gold and silver, while the US dollar has weakened. Oil prices fell on hopes of a deal between the US and Iran, providing another boost to market sentiment. The key question is why have markets rebounded so strongly and, more importantly, whether the recovery can last, given the prior assumption that a blue sweep would have been net negative for stocks?


StoneX Europe Ltd may make third party material available on this website which may contain information included but not limited to the conditions of financial markets. The material is for information purposes only and does not contain, and should not be construed as containing, investment advice and/or investment recommendation and/or an investment research and/or an offer of or solicitation for any transactions in financial instruments; any decision to enter into a specific transaction shall be made by the client following an assessment by him/her of their situation.
StoneX Europe Ltd makes no representation or warranty and assumes no liability as to the accuracy or completeness of the information provided, nor any loss arising from any investment based on a recommendation, forecast or other information supplied. You should always seek independent advice as to your suitability to speculate in any related markets and your ability to assume the associated risks, if you are at all unsure. We are not under any obligation to update any such material. Any opinion made may be personal to the author and may not reflect the opinion of StoneX Europe Ltd.