



Tesla Motors (TSLA) rockets past $1,000, making Elon Musk a quarter-trillionaire
Today’s big rally in Tesla (see chart below) has led to a surge in his net worth, making him arguably the richest person to ever walk the planet at roughly $250B...
Share this:

So much for a quiet start to a busy week!
With more than 30% of the companies that make up the S&P 500 reporting earnings this week alone, stock traders knew it would be a hectic one, and some no doubt hoped they could cruise uneventfully through at least the first session of the week before the pandemonium kicked off.
It was not meant to be however, as Tesla Motors (TSLA), potentially the most actively-traded stock on the planet, absolutely exploded higher on news that rental company Hertz is ordering 100,000 vehicles to build out its EV fleet by the end of 2022. At $4.2B, this marks the single-largest purchase of EVs in history. Some analysts believe this lays the groundwork for other rental companies to make similarly large purchases, paving the way for more adoption of the brand among the general population. Separately, Elon Musk’s company was boosted by an upgrade at Morgan Stanley and news that its Model 3 was the first EV to top new car sales in Europe last month.
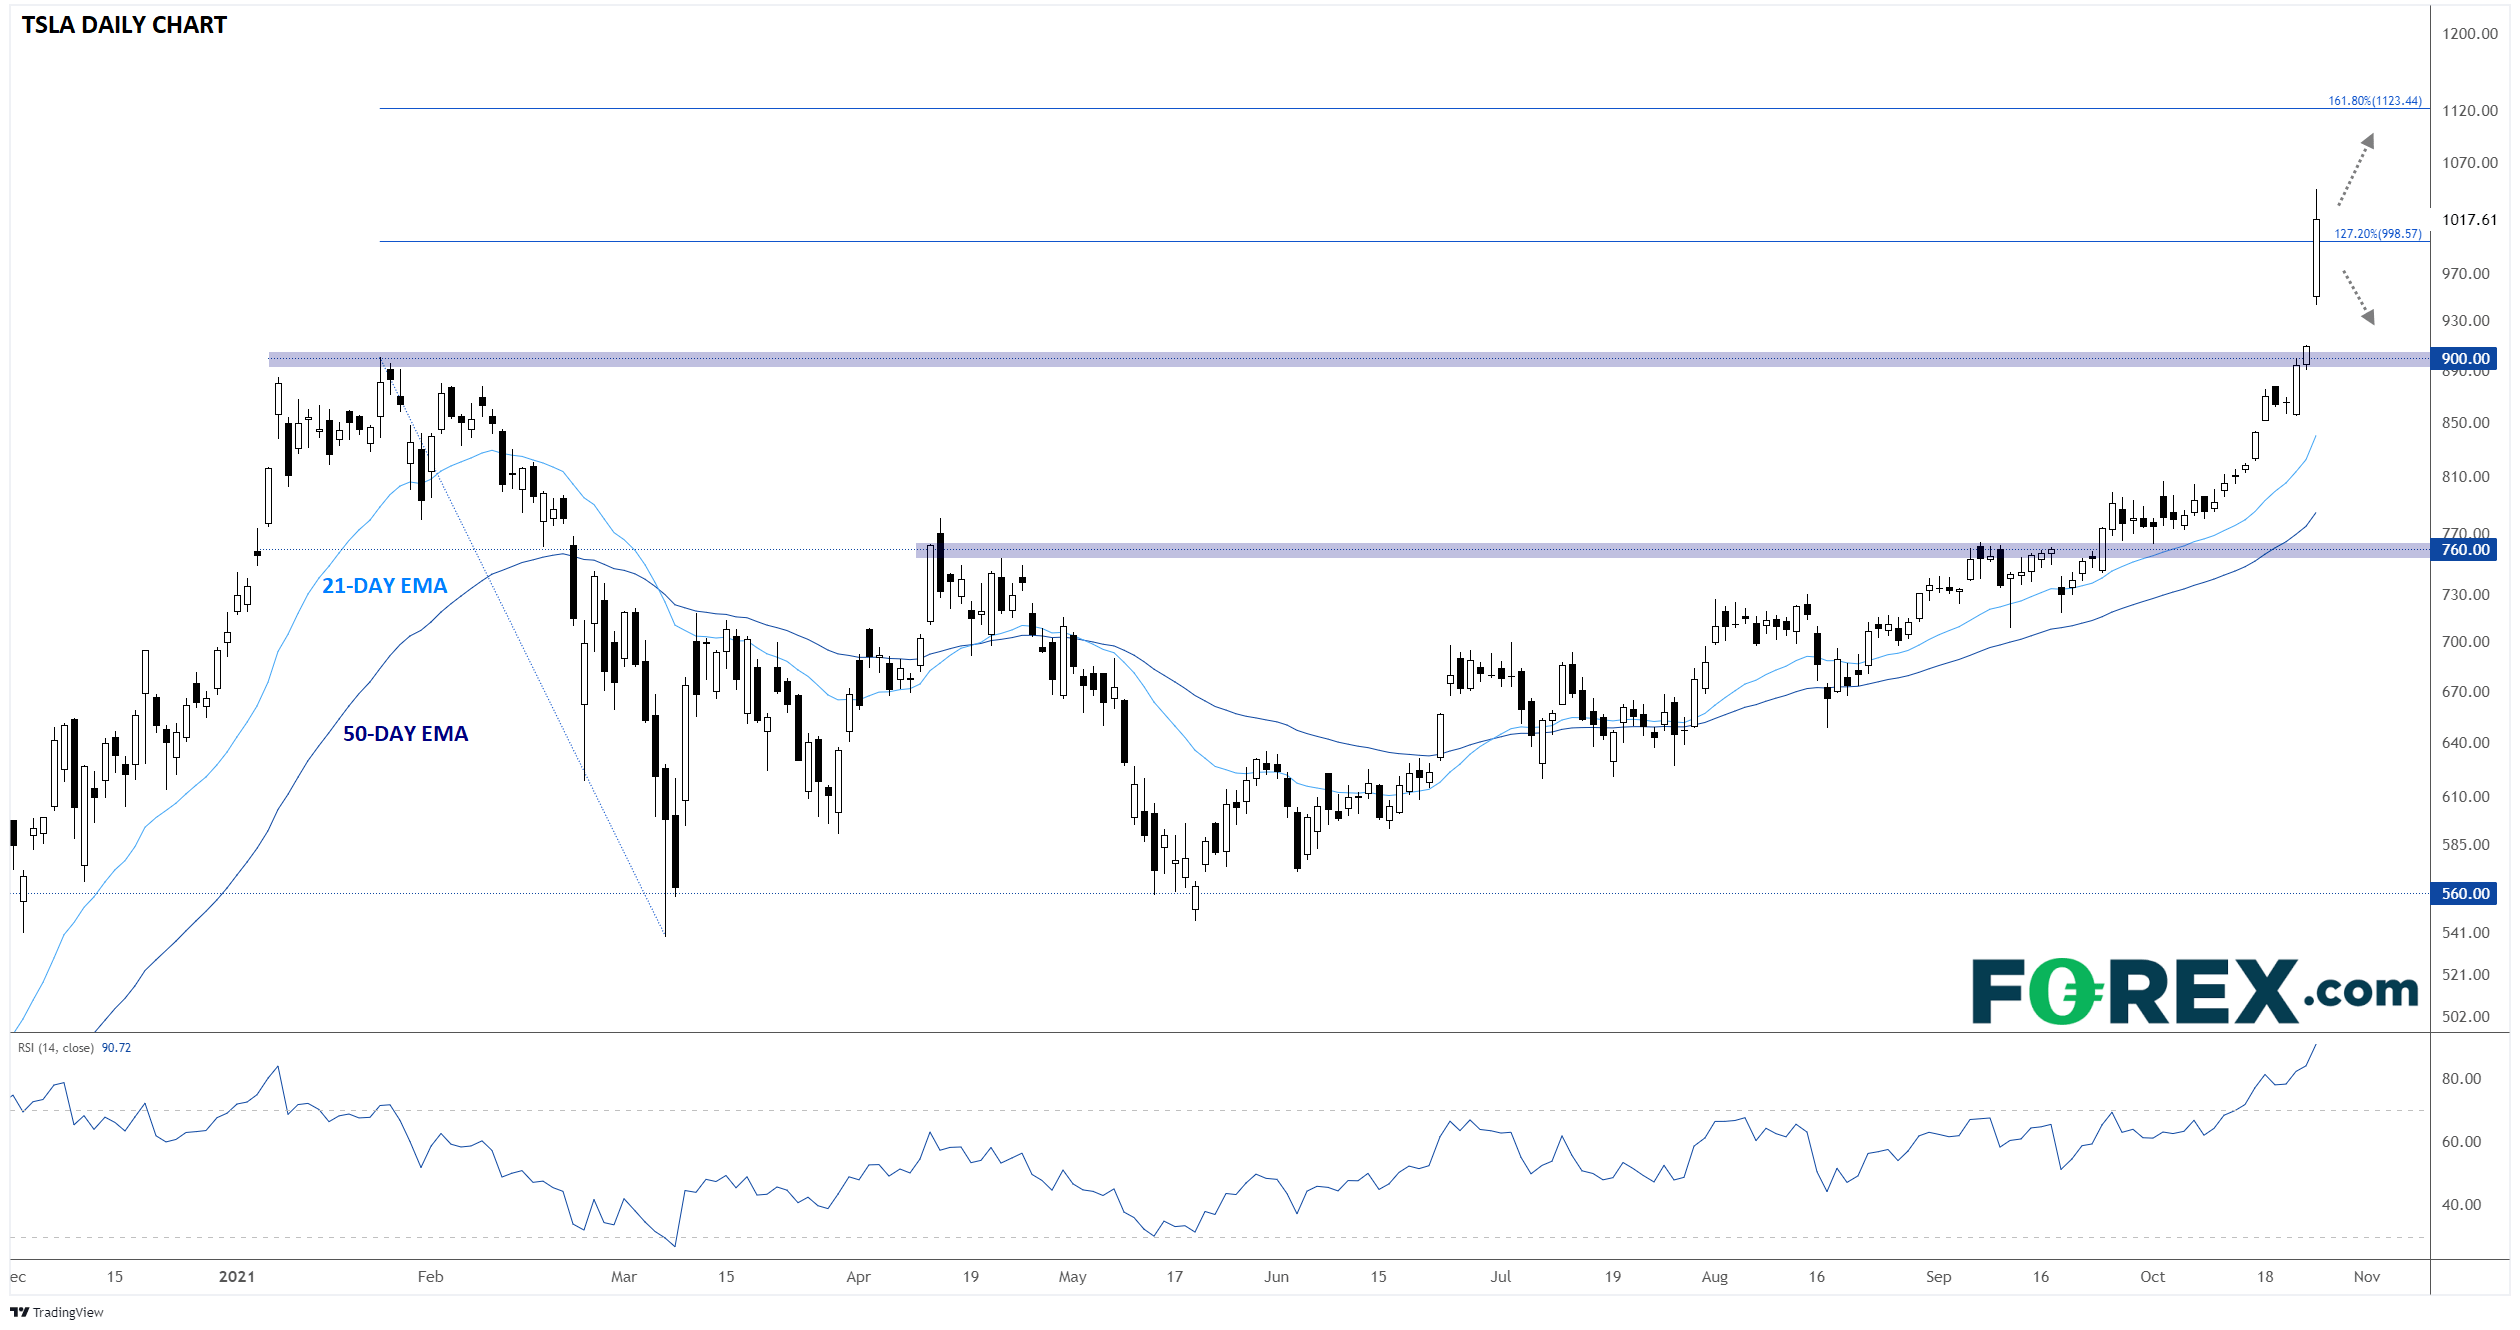
Speaking of Musk, today’s big rally in Tesla (see chart below) has led to a surge in his net worth, making him arguably the richest person to ever walk the planet at roughly $250B. As for the company itself, today’s move has driven Tesla’s market capitalization above $1T, putting in the rarified “quadruple comma” club with (only) Apple, Microsoft, Google, and Amazon as other such members.
Looking at the stock, its clear that the $1,000 level served as a big psychological target once we closed above $900 for the first time on Friday. Moving forward, it will be critical to watch whether shares can hold above the key $1,000 level this week, an area that coincidentally also marks the 127.2% Fibonacci extension of this year’s biggest dip. Above $1,000, the next level to watch from a technical perspective will be the 161.8% Fibonacci extension near $1,125; meanwhile a break back below previous-resistance-turned-support at $900 would throw the near-term bullish bias into question.
Source: TradingView, StoneX
How to trade with FOREX.com
Follow these easy steps to start trading with FOREX.com today:
- Open a Forex.com account, or log-in if you’re already a customer.
- Search for the market you want to trade in our award-winning platform.
- Choose your position and size, and your stop and limit levels.
- Place the trade.
So much for a quiet start to a busy week!
With more than 30% of the companies that make up the S&P 500 reporting earnings this week alone, stock traders knew it would be a hectic one, and some no doubt hoped they could cruise uneventfully through at least the first session of the week before the pandemonium kicked off.
It was not meant to be however, as Tesla Motors (TSLA), potentially the most actively-traded stock on the planet, absolutely exploded higher on news that rental company Hertz is ordering 100,000 vehicles to build out its EV fleet by the end of 2022. At $4.2B, this marks the single-largest purchase of EVs in history. Some analysts believe this lays the groundwork for other rental companies to make similarly large purchases, paving the way for more adoption of the brand among the general population. Separately, Elon Musk’s company was boosted by an upgrade at Morgan Stanley and news that its Model 3 was the first EV to top new car sales in Europe last month.
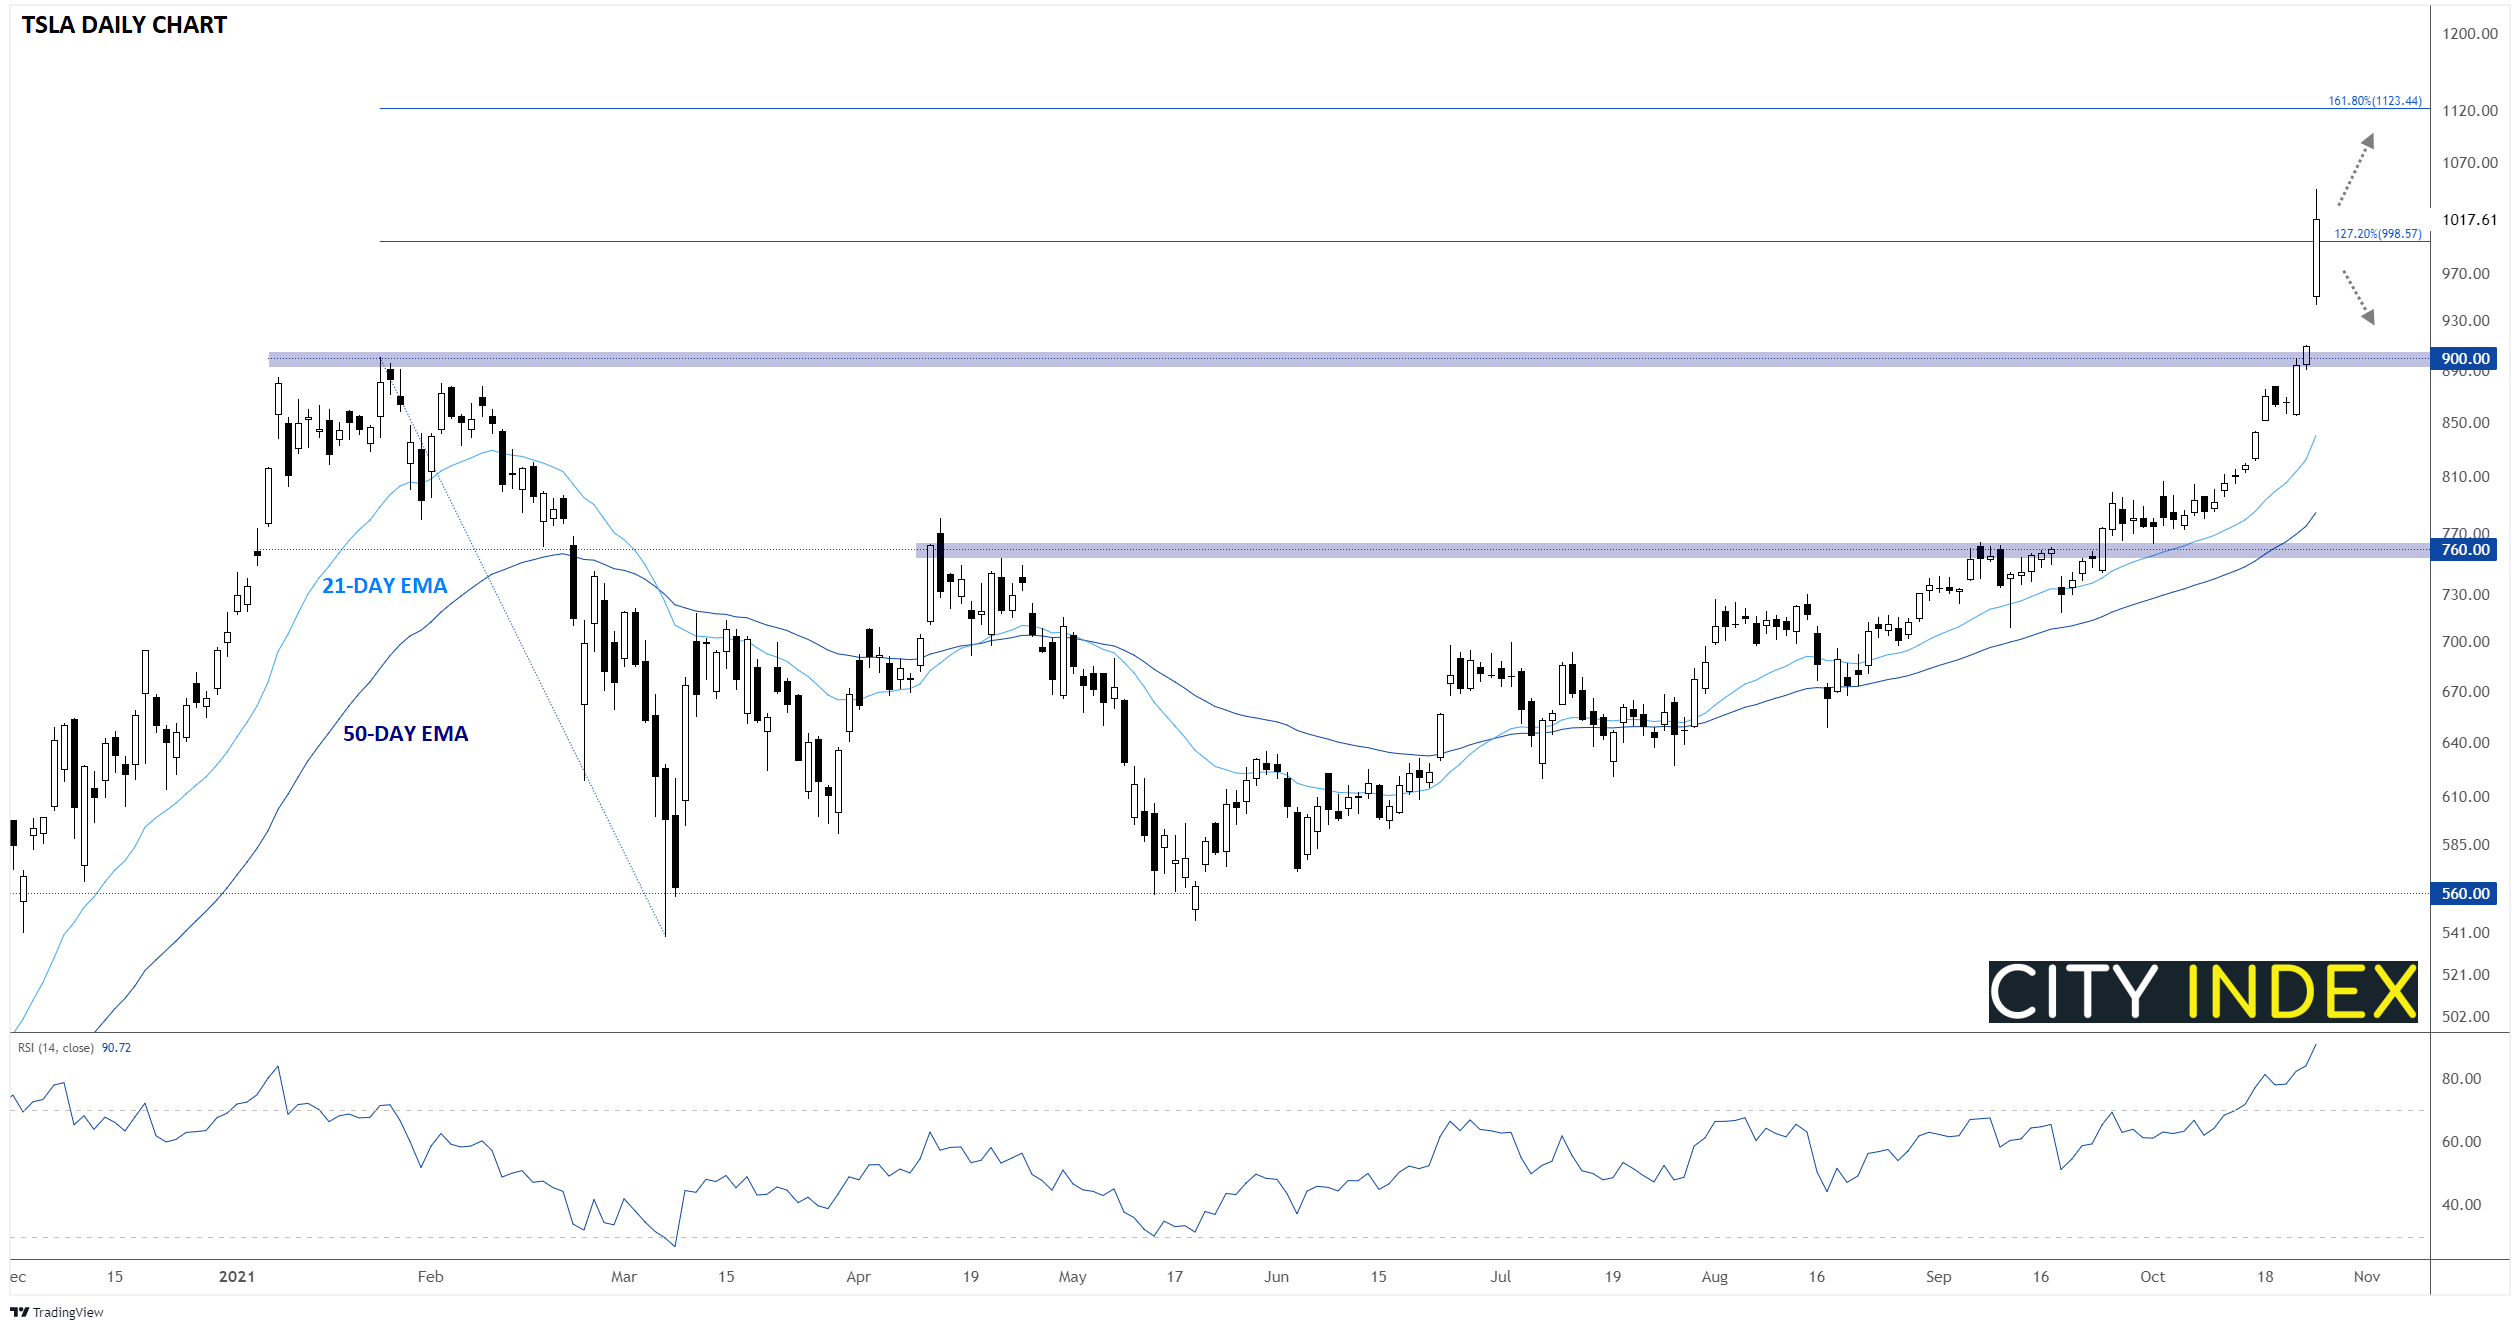
Speaking of Musk, today’s big rally in Tesla (see chart below) has led to a surge in his net worth, making him arguably the richest person to ever walk the planet at roughly $250B. As for the company itself, today’s move has driven Tesla’s market capitalization above $1T, putting in the rarified “quadruple comma” club with (only) Apple, Microsoft, Google, and Amazon as other such members.
Looking at the stock, its clear that the $1,000 level served as a big psychological target once we closed above $900 for the first time on Friday. Moving forward, it will be critical to watch whether shares can hold above the key $1,000 level this week, an area that coincidentally also marks the 127.2% Fibonacci extension of this year’s biggest dip. Above $1,000, the next level to watch from a technical perspective will be the 161.8% Fibonacci extension near $1,125; meanwhile a break back below previous-resistance-turned-support at $900 would throw the near-term bullish bias into question.
Source: TradingView, StoneX
How to trade with City Index
You can trade easily trade with City Index by using these four easy steps:
- Open an account, or log in if you’re already a customer
• Open an account in the UK
• Open an account in Australia
• Open an account in Singapore
- Search for the company you want to trade in our award-winning platform
- Choose your position and size, and your stop and limit levels
- Place the trade
Related tags:
Latest market news




The complete CFD trading experience
Award-winning platforms, competitive spreads, low commissions and dedicated support.
We live and breathe the markets and are dedicated to helping traders realise their ambitions as we continue to set the industry bar.
Economic calendar
Web Trader platform
Our sophisticated web-based platform is packed with features.
Related articles

Nasdaq 100, S&P 500 Smashed as AI Bubble Fears Run Risk Aversion
It’s been a rocky few weeks for stocks starting with a bearish engulf in NVDA a few weeks ago and then the same formation in the S&P 500 two weeks ago. Sellers have since chewed through supports and fear is starting to spread, but is this the beginning of the end for the AI rally?


Magnificent Seven Earnings Preview: Is the AI Boom Facing Its Biggest Test Yet?
After a wobble in the broader AI trade, the Magnificent Seven" stocks are reporting earnings in the coming week - see the key themes and Nasdaq 100 levels to watch!

Stocks on Watch After CPI-Fueled Breakdown: SPX, Nasdaq, NVDA
Coming into the week there was an early case of divergence as AI and tech had started to show lag behind the S&P. That shift is growing more noticeable following a higher-than-expected CPI print.
StoneX Europe Ltd may make third party material available on this website which may contain information included but not limited to the conditions of financial markets. The material is for information purposes only and does not contain, and should not be construed as containing, investment advice and/or investment recommendation and/or an investment research and/or an offer of or solicitation for any transactions in financial instruments; any decision to enter into a specific transaction shall be made by the client following an assessment by him/her of their situation.
StoneX Europe Ltd makes no representation or warranty and assumes no liability as to the accuracy or completeness of the information provided, nor any loss arising from any investment based on a recommendation, forecast or other information supplied. You should always seek independent advice as to your suitability to speculate in any related markets and your ability to assume the associated risks, if you are at all unsure. We are not under any obligation to update any such material. Any opinion made may be personal to the author and may not reflect the opinion of StoneX Europe Ltd.