




Two trades to watch GBPUSD ahead of final Georgia result Greggs slows sales decline
GBP/USD flirts with 1.3650 as the Democrats lead the Georgia runoffs & ahead of UK service sector PMIs Greggs looks to test key 1900 resistance after the rate of sales decline eases.
Share this:

GBP/USD rises as Blues lead in Georgia
GBP/USD is edging higher ahead of the December service sector PMI data and as investors await the final outcome of the Georgia run off election.
At the time of writing Democrat Warnock has won a seat and the votes are still being counted for the second seat. A blue sweep will pave an easier path for Joe Biden to push ahead with his political agenda of reversing Trump’s tax cuts, higher wages and tougher regulation.
UK service sector PMI data is expected to confirm 49.9 a slight contraction in December. However with the UK back in lockdown, this could deteriorate rapidly near term.
BoE Governor Andrew Baily is due to testify before the Treasury Select Committee.
In the US ADP Payroll report and the Fed minutes will be eyed.
Technical outlook
GBP/USD is flirting with $1.3650. It trades above its 50 & 20 sma bouncing off the latter when it eased back earlier in the session. The RSI also supports the bullish momentum as it sits above 50 but well below over bought territory suggesting that more upside could be on the cards.
A meaningful move of 1.3650 is required in order to retest recent highs of 1.37.
On the flip side a move below the 20 sma at 1.3620 could open the door to 50 sma at 1.3560 and 1.3535 January’s low.

On the flip side a move below the 20 sma at 1.3620 could open the door to 50 sma at 1.3560 and 1.3535 January’s low.
Learn more about trading currencies
Greggs jumps 4%, can it rise higher?
The bakery chain expects loss before tax for the year ended January 2nd to be up to £15 million, down from a record £108 million profit recorded a year earlier after Q4 sales plummeted 15% to £293 million.However, Greggs had managed to slow the rate of sales decline as Q4 LFL sales averaged 81.1% of 2019’s an improvement from 71.2% in Q3. This suggests that Greggs is adapting to the pandemic challenges it faces, lifting the stock in early trade.
Technical outlook
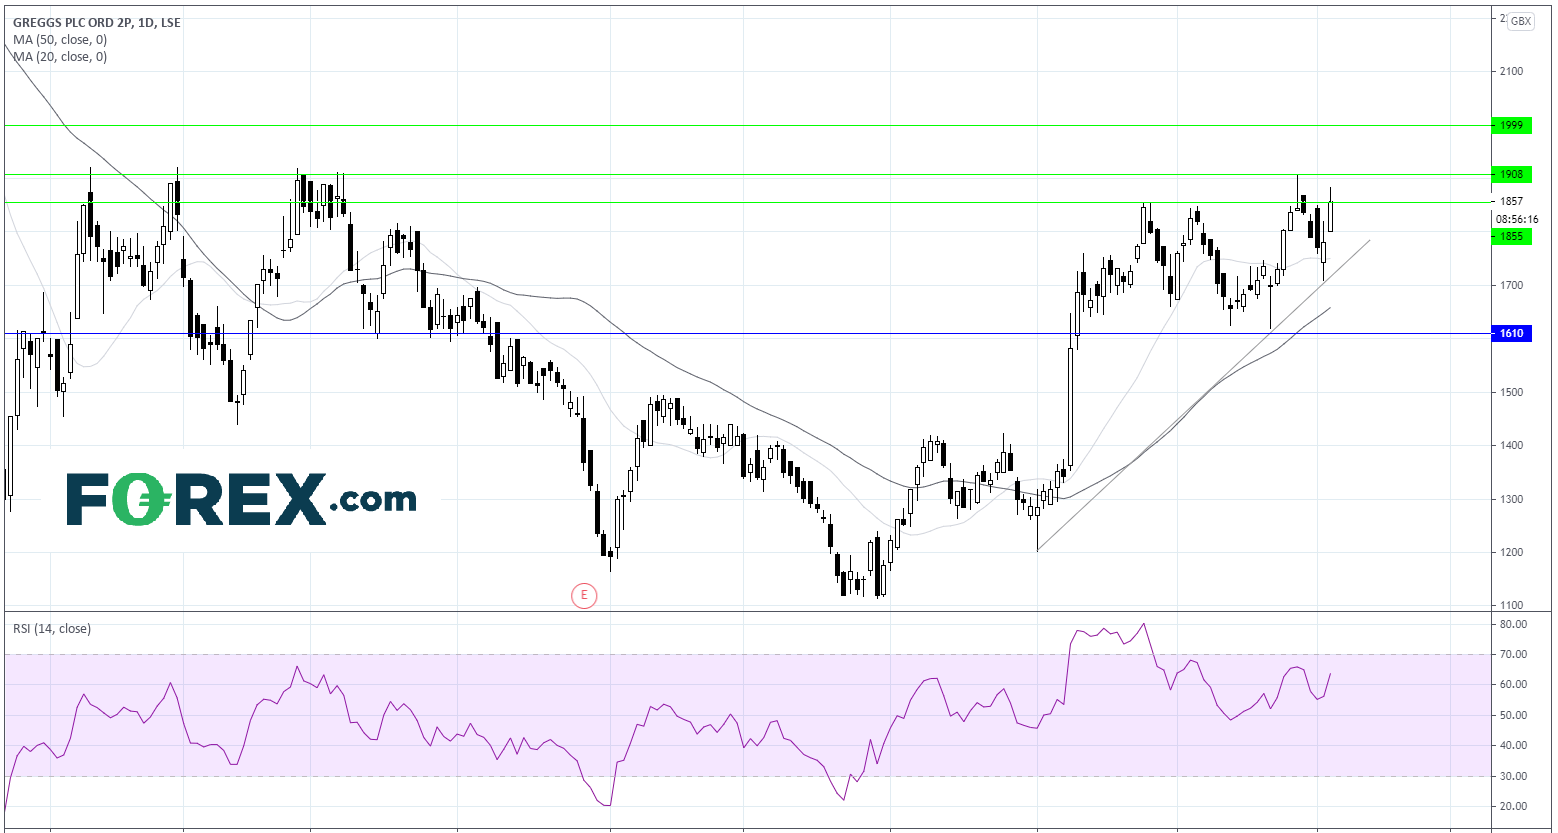
Greggs has jumped over 4% higher on the open taking it over the upper band of a horizontal channel that it has traded in since early November.
Greggs has jumped over 4% higher on the open taking it over the upper band of a horizontal channel that it has traded in since early November.
Greggs trades above its 20 & 50 day sma and above its ascending trend line dating back to early November signaling an established bullish trend.
The RSI is in bullish territory above 50, but still comfortably below 70 suggesting that there could be more upside to come.
A meaningful break through the channel upper band at 1850 could see 1900/10 tested a level which the share price has failed to push above despite several attempts over the past 9 months. Beyond here 2000 the psychological level comes into focus
On the flip side support can be seen at 1800 horizontal support prior to 1750 20 sma and 1720 ascending trend line. A break below 50 sma 1650 is needed to for a deeper selloff.
Learn more about trading shares
GBP/USD rises as Blues lead in Georgia
GBP/USD is edging higher ahead of the December service sector PMI data and as investors await the final outcome of the Georgia run off election.
At the time of writing Democrat Warnock has won a seat and the votes are still being counted for the second seat. A blue sweep will pave an easier path for Joe Biden to push ahead with his political agenda of reversing Trump’s tax cuts, higher wages and tougher regulation.
UK service sector PMI data is expected to confirm 49.9 a slight contraction in December. However with the UK back in lockdown, this could deteriorate rapidly near term.
BoE Governor Andrew Baily is due to testify before the Treasury Select Committee.
In the US ADP Payroll report and the Fed minutes will be eyed.
Technical outlook
GBP/USD is flirting with $1.3650. It trades above its 50 & 20 sma bouncing off the latter when it eased back earlier in the session. The RSI also supports the bullish momentum as it sits above 50 but well below over bought territory suggesting that more upside could be on the cards.
A meaningful move of 1.3650 is required in order to retest recent highs of 1.37.
On the flip side a move below the 20 sma at 1.3620 could open the door to 50 sma at 1.3560 and 1.3535 January’s low.

On the flip side a move below the 20 sma at 1.3620 could open the door to 50 sma at 1.3560 and 1.3535 January’s low.
Learn more about trading currencies
Greggs jumps 4%, can it rise higher?
The bakery chain expects loss before tax for the year ended January 2nd to be up to £15 million, down from a record £108 million profit recorded a year earlier after Q4 sales plummeted 15% to £293 million.However, Greggs had managed to slow the rate of sales decline as Q4 LFL sales averaged 81.1% of 2019’s an improvement from 71.2% in Q3. This suggests that Greggs is adapting to the pandemic challenges it faces, lifting the stock in early trade.
Technical outlook
Greggs has jumped over 4% higher on the open taking it over the upper band of a horizontal channel that it has traded in since early November.
Greggs trades above its 20 & 50 day sma and above its ascending trendline dating back to early November signaling an established bullish trend.
Greggs has jumped over 4% higher on the open taking it over the upper band of a horizontal channel that it has traded in since early November.
Greggs trades above its 20 & 50 day sma and above its ascending trendline dating back to early November signaling an established bullish trend.
The RSI is in bullish territory above 50, but still comfortably below 70 suggesting that there could be more upside to come.
A meaningful break through the channel upper band at 1850 could see 1900/10 tested a level which the share price has failed to push above despite several attempts over the past 9 months. Beyond here 2000 the psychological level comes into focus
On the flip side support can be seen at 1800 horizontal support prior to 1750 20 sma and 1720 ascending trend line. A break below 50 sma 1650 is needed to for a deeper selloff.
Learn more about trading shares




The complete CFD trading experience
Award-winning platforms, competitive spreads, low commissions and dedicated support.
We live and breathe the markets and are dedicated to helping traders realise their ambitions as we continue to set the industry bar.
Economic calendar
Web Trader platform
Our sophisticated web-based platform is packed with features.
Related articles

S&P 500, Nasdaq, Dow Forecast: Rising Yields Test Rally Ahead of Nvidia, Fed 8 22 2026
S&P 500, Nasdaq and Dow test key technical levels as momentum fades, raising the risk of a deeper correction heading into a pivotal week.


GBPUSD Analysis Pound holds firm after BoE decision
The pound sterling has started to show relevant strength against the U.S. dollar. At the moment, GBP/USD has gained slightly more than 1.3% in the short term, reflecting an important buying bias.


Magnificent Seven Earnings Preview: Can Big Tech Reclaim AI Leadership?
The Magnificent Seven enter earnings with far more divided performance than in previous years, as investors increasingly distinguish between companies supplying the AI buildout and those funding it - what does that mean heading into earnings season?

StoneX Europe Ltd may make third party material available on this website which may contain information included but not limited to the conditions of financial markets. The material is for information purposes only and does not contain, and should not be construed as containing, investment advice and/or investment recommendation and/or an investment research and/or an offer of or solicitation for any transactions in financial instruments; any decision to enter into a specific transaction shall be made by the client following an assessment by him/her of their situation.
StoneX Europe Ltd makes no representation or warranty and assumes no liability as to the accuracy or completeness of the information provided, nor any loss arising from any investment based on a recommendation, forecast or other information supplied. You should always seek independent advice as to your suitability to speculate in any related markets and your ability to assume the associated risks, if you are at all unsure. We are not under any obligation to update any such material. Any opinion made may be personal to the author and may not reflect the opinion of StoneX Europe Ltd.