





USD/CHF Struggles After Testing Former Support Zone
USD/CHF falls for the second day after testing the former support zone around the April low (0.8040).
Share this:

US Dollar Outlook: USD/CHF
USD/CHF falls for the second day after testing the former support zone around the April low (0.8040), and the exchange rate may give back the rebound from the monthly low (0.7872) should it continue to track the negative slope in the 50-Day SMA (0.8132).
USD/CHF Struggles After Testing Former Support Zone
Keep in mind, the recent rebound in USD/CHF pulled the Relative Strength Index (RSI) out of oversold territory, and the exchange rate may consolidate over the coming days as long as the oscillator holds above 30.
Join David Song for the Weekly Fundamental Market Outlook webinar. David provides a market overview and takes questions in real-time. Register Here
However, USD/CHF carves a series of lower highs and lows as it continues to fall from the monthly high (0.8064), and the recovery from the start of July may turn out to be temporary as the Federal Reserve remains under pressure from the Trump Administration to implement lower US interest rates.
With that said, the US Dollar may continue to deprecate against its Swiss counterpart as Fed officials still forecast that ‘the appropriate level of the federal funds rate will be 3.9 percent at the end of this year,’ and USD/CHF may give back the rebound from the monthly low (0.7872) as it carves a series of lower highs and lows.
USD/CHF Price Chart – Daily
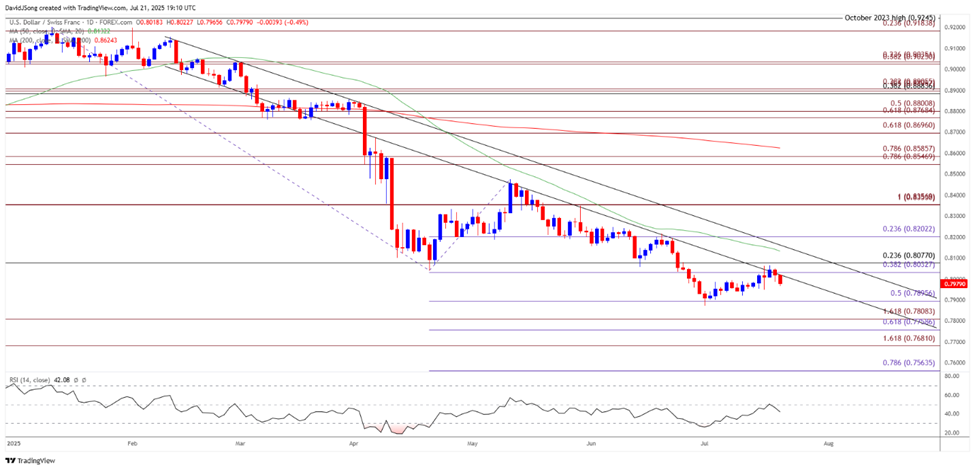
Chart Prepared by David Song, Senior Strategist; USD/CHF Price on TradingView
- USD/CHF struggles following the failed attempt to push back above the former support zone around 0.8030 (38.2% Fibonacci extension) to 0.8080 (23.6% Fibonacci retracement), and a move below 0.7900 (50% Fibonacci extension) may lead to a test of the monthly low (0.7872).
- A move/close below the 0.7760 (61.8% Fibonacci extension) to 0.7810 (161.8% Fibonacci extension) region brings 0.7680 (161.8% Fibonacci extension) on the radar, with the next area of interest coming in around 0.7560 (78.6% Fibonacci extension).
- At the same time, a move/close above the 0.8030 (38.2% Fibonacci extension) to 0.8080 (23.6% Fibonacci retracement) zone may push USD/CHF toward 0.8200 (23.6% Fibonacci extension), with the next area of interest coming in around the June high (0.8250).
--- Written by David Song, Senior Strategist
Follow on Twitter at @DavidJSong
Related tags:




The complete CFD trading experience
Award-winning platforms, competitive spreads, low commissions and dedicated support.
We live and breathe the markets and are dedicated to helping traders realise their ambitions as we continue to set the industry bar.
Economic calendar
Web Trader platform
Our sophisticated web-based platform is packed with features.
Related articles

Swiss Franc Technical Outlook: USD/CHF Reversal Puts Major Support in Focus 10 21 2026
USD/CHF bears are looking to build on last week’s sharp reversal, with a looming support test threatening the broader recovery.


US Dollar, GBP/USD, USD/CAD, USD/CHF, Gold Weekly Technical Outlook 10 19 2026
Sr. Technical Strategist Michael Boutros highlights the levels that matter on the USD Majors, commodities, and equity indices charts this week.

Swiss Franc Forecast: USD/CHF Seven-Week Rally Reverses From Yearly Highs 10 16 2026
A sharp rejection from fresh highs has shifted momentum in favor of USD/CHF bears, raising the stakes for a critical support test.
StoneX Europe Ltd may make third party material available on this website which may contain information included but not limited to the conditions of financial markets. The material is for information purposes only and does not contain, and should not be construed as containing, investment advice and/or investment recommendation and/or an investment research and/or an offer of or solicitation for any transactions in financial instruments; any decision to enter into a specific transaction shall be made by the client following an assessment by him/her of their situation.
StoneX Europe Ltd makes no representation or warranty and assumes no liability as to the accuracy or completeness of the information provided, nor any loss arising from any investment based on a recommendation, forecast or other information supplied. You should always seek independent advice as to your suitability to speculate in any related markets and your ability to assume the associated risks, if you are at all unsure. We are not under any obligation to update any such material. Any opinion made may be personal to the author and may not reflect the opinion of StoneX Europe Ltd.