







USD index slumps as weak ISM gifts AUD/USD its breakout ahead of NFP
A softer-than-expected ISM services report was the gift that Fed doves have been waiting for ahead of tomorrow's NFP report. The USD index is now on track for a 3-week reversal pattern below resistance, and AUD/USD has broken out in style.
Share this:

A softer-than-expected ISM services report was the gift that Fed doves have been waiting for ahead of a key Nonfarm payroll report on Friday. It also made for a lively session on the eve of Independence Day, with liquidity expected to be much lower today heading into tomorrow’s employment data.
At 48.8, the headline ISM figure was its fastest pace of contraction since the pandemic in May 2020. New orders also slumped to 47.3, its lowest point since the pandemic, employment contracted a slightly faster pace of 46.1 and prices were a touch lower at 56.3. With signs that the employment sector is deteriorating elsewhere for the US, the places greater emphasis on tomorrow's nonfarm payroll report. And more specifically, the unemployment number will garner more interest than usual given that Powell said on Tuesday that 4% unemployment was still relatively low. And with the consensus estimate for unemployment to fall to 3.8%, markets will likely be very excited with a print of 4.1% or higher given the weak data have seen this week so far this week.
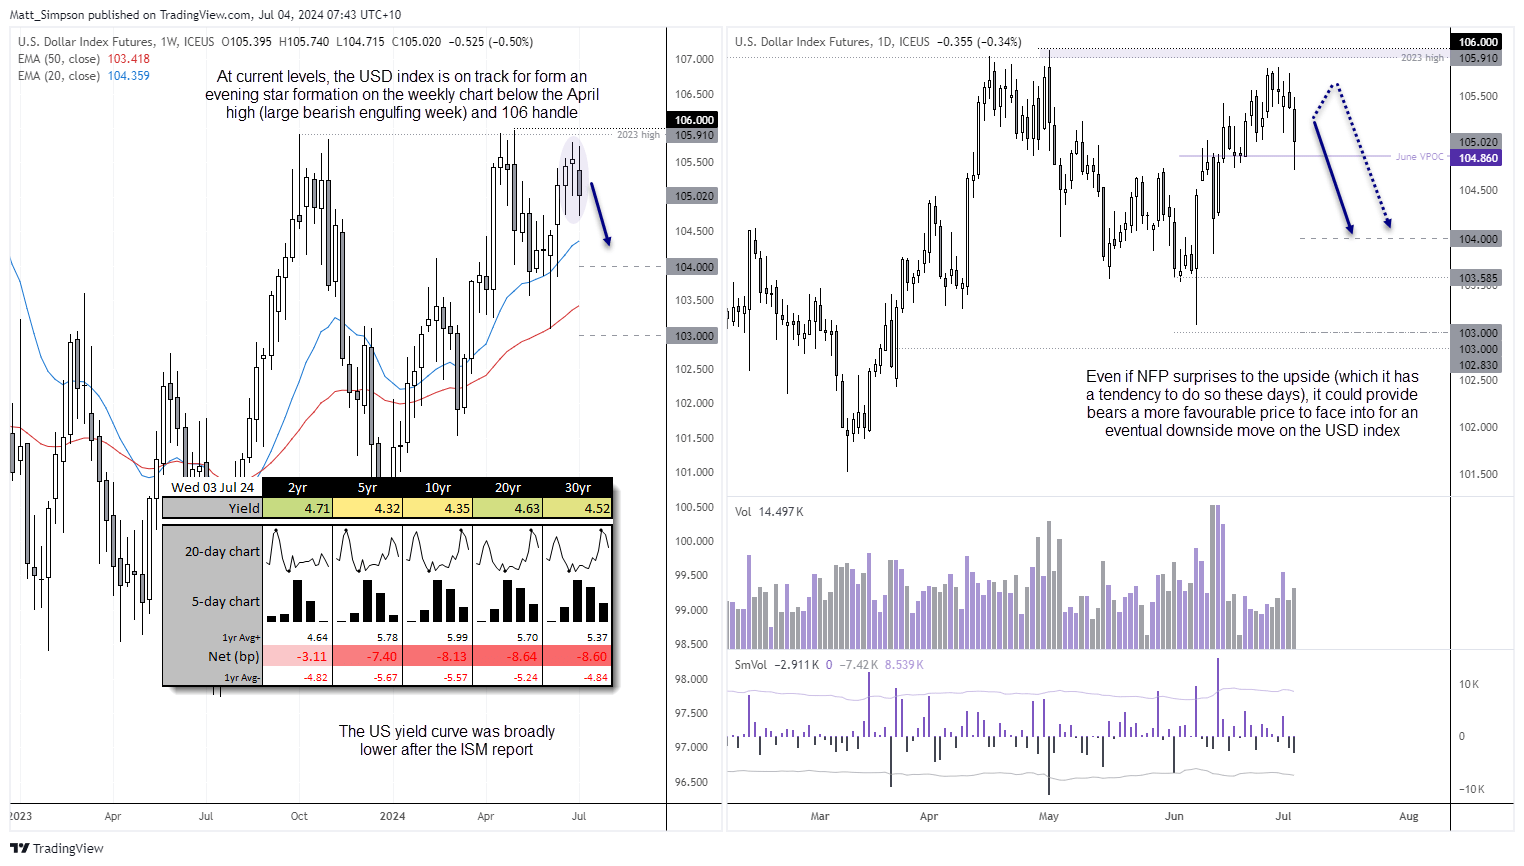
Naturally, this is exciting news for anyone seeking Fed cuts, even if it could suggest the Fed has finally broken something. Fed fund futures are now implying a 66.5% chance of a September cut, with a second cut in December implied with a 44.8% probability. Markets reacted accordingly: The US dollar index fell for the 5th consecutive time, during its worst session in three weeks. The US yield curve was broadly lower, with 10-year yields falling around 8 basis points. The two-year yield was three basis points lower. The 10-year yield now sits at 4.35%, which means it has now retraced around half of the gains made after Biden’s disastrous debate against Donald Trump.
USD Index technical analysis:
At current levels, the weekly chart is on track to break a four-week winning streak and complete a three-week bearish reversal pattern called an evening star formation. The fact that the market has failed to retest the large bearish engulfing candle high set in April, and therefore not retest 106, suggests that we could be looking at the early stages of a bearish reversal for the US dollar.
The daily chart shows momentum has clearly rolled over for the US dollar, even if the market rebounded back above the June VPOC (volume point of control). Given the bearish clues on the weekly chart, the US dollar index seems a market primed for bears to fade into rallies and seek moves down to the 104 or even 103 handles. We should factor in that NFP has a tendency to surprise to the upside these days, but even then, I doubt it will have the ability to simply smash 106. So, a hot NFP report tomorrow could provide a better entry for bears to fade into. Obviously, a weak NFP report could see downside momentum for the US accelerate.
Economic events (times in AEST)
- 11:00 – Australian trade balance, building approvals
- 15:45 – Swiss inflation
- 17:30 – German construction PMI
- 18:30 – UK construction PMI
- 19:00 – ECB Lane speaks
- 20:00 – UK General election
AUD/USD technical analysis:
The Australian dollar finally saw the upside break we've been anticipating. AUD/USD saw a clear break above 67c, although a higher wick has formed and price of now retraced very close to that level. Given US Independence Day holiday today and NFP tomorrow, we could find volatility on the lower side for now. But with the trend structure clearly pointing higher, the bias remains to buy dips the Aussie from move up to 68c or even 69c.
The one-hour chart shows that the acceleration higher was accompanied by very high volumes, which indicates that bulls were behind the move. The price retraced back to the monthly R1 pivot point and the 67 cents level, so perhaps we’ll get treated to a little bounce today. The question is whether we’ll see decent follow-through, given expectations of lower liquidity around the holiday period in the US. But with a strong bullish trend structure on the daily and one-hour timeframes, dips are likely to appear favourable to bullish swing traders.
View the full economic calendar
View the full economic calendar
-- Written by Matt Simpson
Follow Matt on Twitter @cLeverEdge
How to trade with City Index
You can trade with City Index by following these four easy steps:
- Open an account, or log in if you’re already a customer
• Open an account in the UK
• Open an account in Australia
• Open an account in Singapore
- Search for the market you want to trade in our award-winning platform
- Choose your position and size, and your stop and limit levels
- Place the trade
Related tags:


The complete CFD trading experience
Award-winning platforms, competitive spreads, low commissions and dedicated support.
We live and breathe the markets and are dedicated to helping traders realise their ambitions as we continue to set the industry bar.
Economic calendar
Web Trader platform
Our sophisticated web-based platform is packed with features.
Related articles

USD/JPY weekly outlook: Quarter turn scrambles rates regime
USD/JPY’s tight relationship with front-end US rates broke down sharply last week, but quarter-turn flows and positioning suggest the disconnect may prove temporary.


USD/CAD forecast: rally could accelerate above June highs at 1.4250
USD/CAD recovered quickly after weaker US jobs data, keeping the bullish trend in focus. A move above the June highs could accelerate the rally as inflation keeps the Fed under pressure.


USD Sets Fresh Yearly High as EUR/USD Drops Dramatically, USD/JPY Stable
Well, it was a week of USD strength that wasn’t entirely pushed by USD/JPY, as a strong sell-off in EUR/USD has pushed the major pair to its most oversold state in a decade.
StoneX Europe Ltd may make third party material available on this website which may contain information included but not limited to the conditions of financial markets. The material is for information purposes only and does not contain, and should not be construed as containing, investment advice and/or investment recommendation and/or an investment research and/or an offer of or solicitation for any transactions in financial instruments; any decision to enter into a specific transaction shall be made by the client following an assessment by him/her of their situation.
StoneX Europe Ltd makes no representation or warranty and assumes no liability as to the accuracy or completeness of the information provided, nor any loss arising from any investment based on a recommendation, forecast or other information supplied. You should always seek independent advice as to your suitability to speculate in any related markets and your ability to assume the associated risks, if you are at all unsure. We are not under any obligation to update any such material. Any opinion made may be personal to the author and may not reflect the opinion of StoneX Europe Ltd.