


USD/JPY Fed-Fueled Pullback Ahead of BoJ
USD/JPY has a theoretical cap after the intervention in July and then the verbal threats thereafter, but the big question now is whether a larger case of carry unwind lurks around the next corner.
Share this:

USD/JPY Talking Points:
- USD/JPY has retained a bullish bias after support pullbacks but last week threw a curveball as the pair sold off alongside the broader tech pullback.
- A morning star formation finished on the daily chart after Monday and that continued into strength on Tuesday. But that rally found resistance on Wednesday around the FOMC meeting and this brings to question trend potential ahead of the BoJ meeting later this week.
- The BoJ is widely expected to hold rates but hint at rate hikes in December, but with the Fed also expected to hike could there be enough to compel a larger reversal of the broader trend?
The carry trade in USD/JPY remains loaded as the pair is right around 54% above the early 2021 levels, and for a major currency pair that’s a massive move that has outsized repercussions. And while both the US and Japan would probably prefer a degree of stability in the pair, markets aren’t always one to comply as profit motive can create volatility such as we saw back in July.
USD/JPY Weekly Chart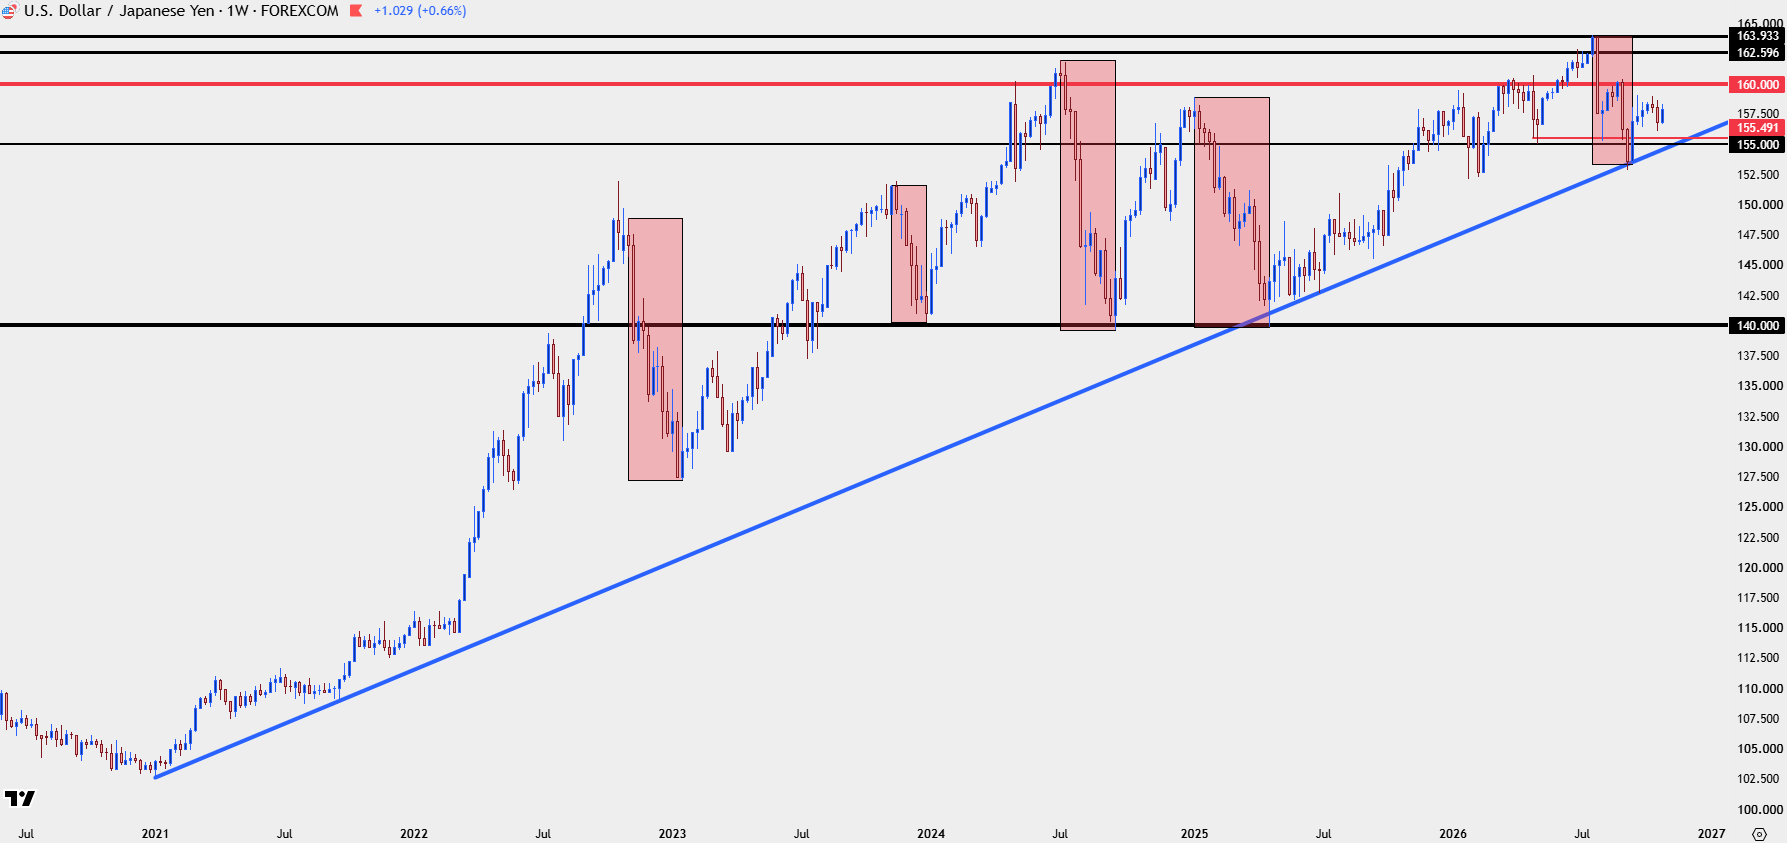
Chart prepared by James Stanley; data derived from Tradingview
USD/JPY Fear Begins to Show
The 156.68 level is one that I’ve been following for some time, and this helped to set the low last Thursday. Interestingly, however, this came amidst a backdrop where fear had appeared in other pockets of the market, such as Japanese or Korean stocks, to go along with a sizable pullback in the Nasdaq and AI stocks in the US.
On Friday, that level was broken, albeit briefly, and as I covered in the Top 5 Charts for the Week Ahead, this put USD/JPY in a possibly precarious spot should sellers continue to push, highlighting the fear that an unwinding carry trade could create a de-leveraging event elsewhere.
So far this week, that fear has taken a back seat. A Monday rally continued into a morning star formation, and that has continued for a push up to the 158.05 level.
So far on the daily, we have a doji although that can change in the final couple hours of trading but this highlights a Fed that brought little surprise and a BoJ that’s widely expected to push a hawkish hold at their meeting later this week.
USD/JPY Daily Chart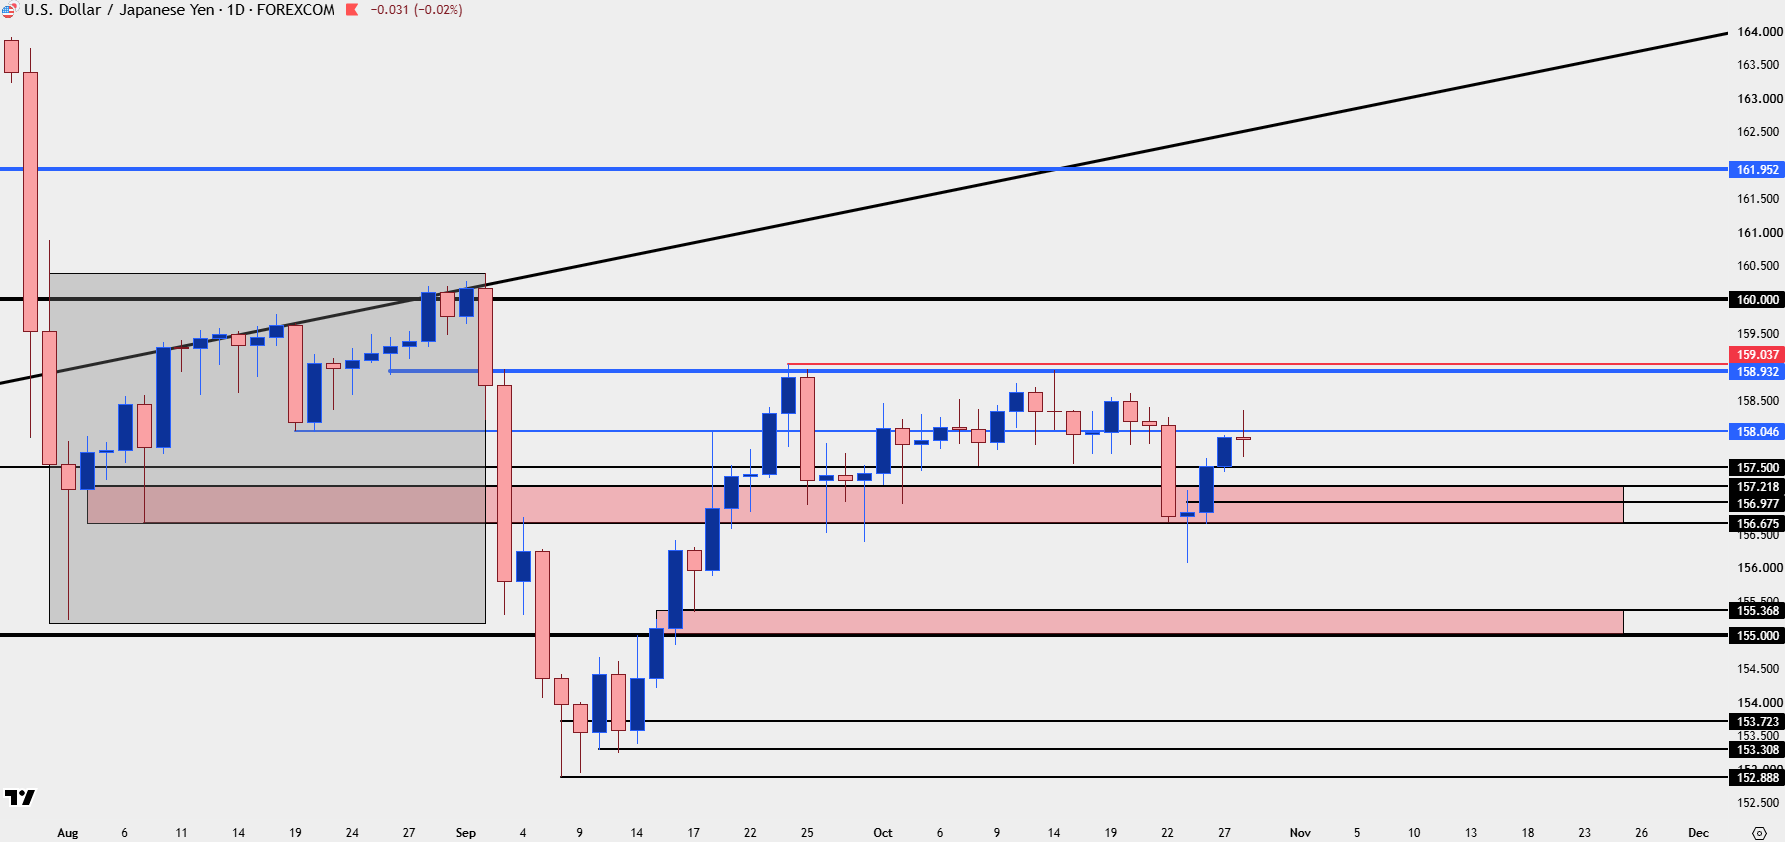
Chart prepared by James Stanley; data derived from Tradingview
USD/JPY Shorter-Term
While the current doji on the daily might not seem foreboding, the four-hour bar his showing a bearish engulf, and that’s the kind of thing that traders looking to fade a sell-off should respect. This puts pressure on the downside, and opens up the possibility of a push to the 157.50 psychological level, or perhaps the 157.22 level that marks the top-end of the longer-term support zone.
USD/JPY Four-Hour Chart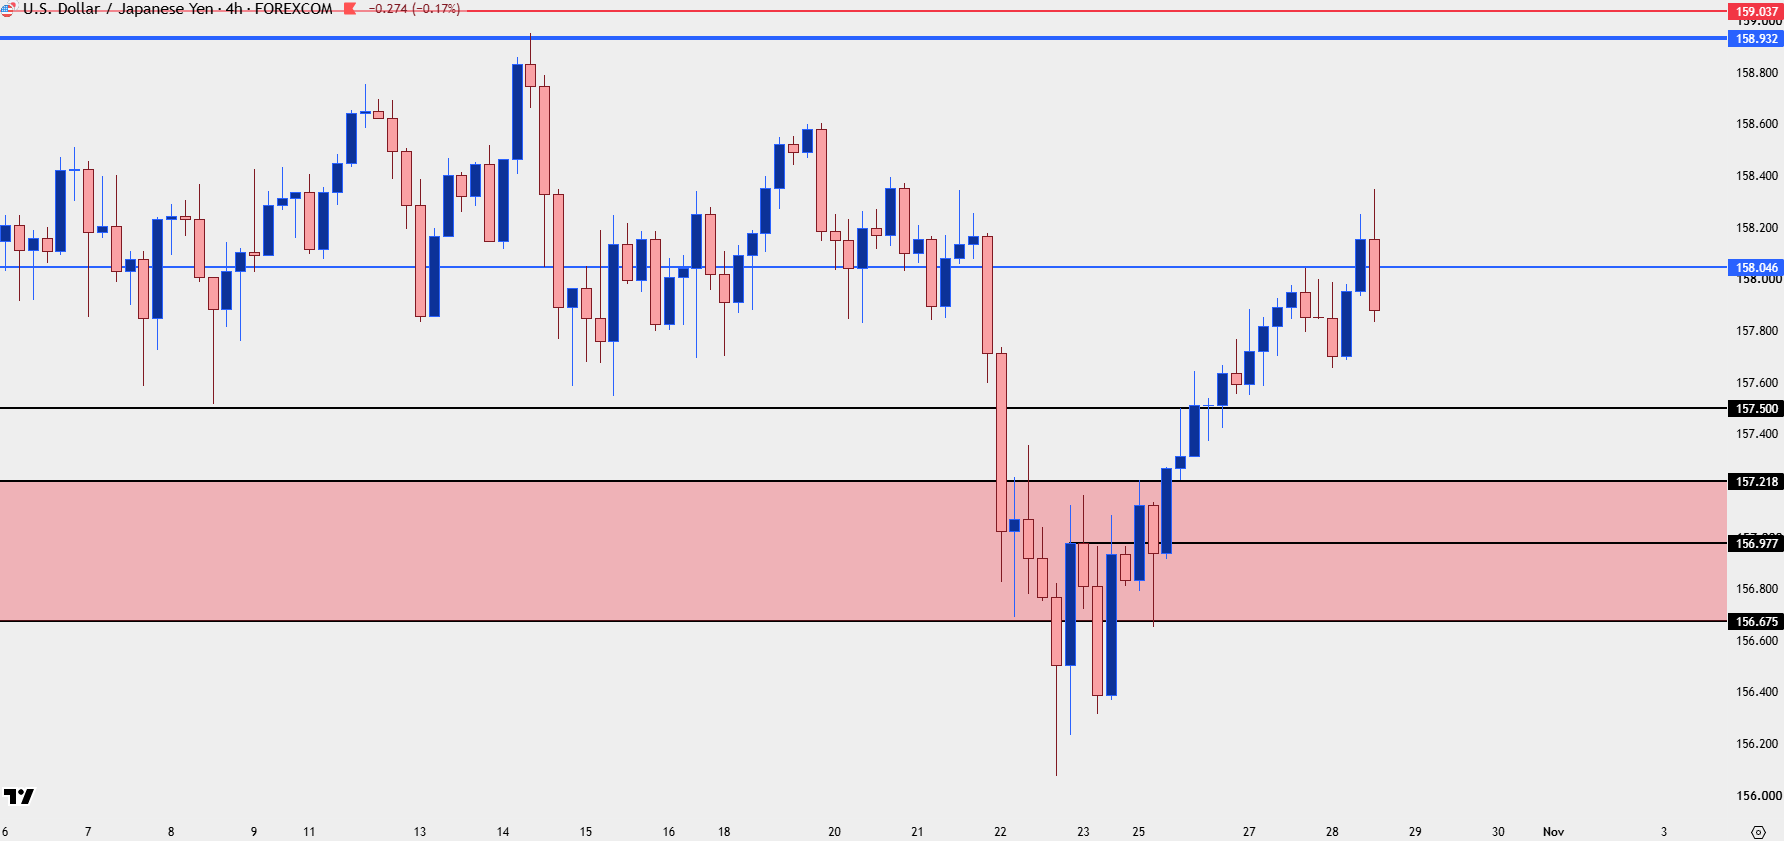
Chart prepared by James Stanley; data derived from Tradingview
--- written by James Stanley, Senior Market Analyst, Global Macro
Related tags:



The complete CFD trading experience
Award-winning platforms, competitive spreads, low commissions and dedicated support.
We live and breathe the markets and are dedicated to helping traders realise their ambitions as we continue to set the industry bar.
Economic calendar
Web Trader platform
Our sophisticated web-based platform is packed with features.
Related articles
USD/JPY Fed-Fueled Pullback Ahead of BoJ
USD/JPY has a theoretical cap after the intervention in July and then the verbal threats thereafter, but the big question now is whether a larger case of carry unwind lurks around the next corner.

Gold Bounces from $4k – Are Bears Finished?
Gold has so far bounced from the $4k level following last week’s sell-off but whether a low is in-place will highly depend on how the Central Bank meetings remaining on the calendar for the rest of this week roll out.

Pre-FOMC US Dollar Price Action Setups: EUR/USD, USD/JPY, GBP/USD, USD/CAD
Tomorrow brings the Fed and then mid-term elections next week and CPI the week after, so we have a loaded few weeks ahead as USD strength remains in-play.
StoneX Europe Ltd may make third party material available on this website which may contain information included but not limited to the conditions of financial markets. The material is for information purposes only and does not contain, and should not be construed as containing, investment advice and/or investment recommendation and/or an investment research and/or an offer of or solicitation for any transactions in financial instruments; any decision to enter into a specific transaction shall be made by the client following an assessment by him/her of their situation.
StoneX Europe Ltd makes no representation or warranty and assumes no liability as to the accuracy or completeness of the information provided, nor any loss arising from any investment based on a recommendation, forecast or other information supplied. You should always seek independent advice as to your suitability to speculate in any related markets and your ability to assume the associated risks, if you are at all unsure. We are not under any obligation to update any such material. Any opinion made may be personal to the author and may not reflect the opinion of StoneX Europe Ltd.