




USD Sell-Off on Trump’s Powell Threat: EUR/USD, GBP/USD, USD/JPY
While Trump walked back last week’s threat to fire Jerome Powell the heat hasn’t stopped, and next week we’ll see if the Fed starts to lay the groundwork for 2025 rate cuts.
Share this:

U.S. Dollar Talking Points:
- Yen-strength has continued through the week’s open and that furthers a move that started with USD/JPY gapping down through the start of trading on Sunday.
- In last Tuesday’s webinar I warned that I expected Trump to threaten Powell’s position atop the Fed as USD-strength had held from the CPI report. That showed up a day later and since then USD bulls haven’t been able to re-take control of the currency.
- The next major driver is the FOMC rate decision next Wednesday and there remains fanfare around the Powell topic, as he’s now been referred to the Department of Justice by a sitting member of Congress. With four meetings remaining in the year and two 25 bp cuts expected, the big question is whether the Fed uses next Wednesday to open the door to a move in September.
- To join the next webinar, click here to register.
Last week in the webinar, during the section around stocks, I shared my expectation that President Trump would threaten to fire Jerome Powell. This was largely in response to the USD rally that had taken-hold from the Q3 open, which had extended in the aftermath of the CPI report earlier that morning. With inflation pushing higher the prospect of rate cuts from the Fed looks less and less likely, and that’s not to mention the general opinion from many Fed members that tariffs could produce even more inflation. So, with the USD rallying, I estimated that President Trump would go back to a familiar strategy of threatening to replace the head of the FOMC, which markets would then read as a higher probability of dovish policy to suit the President’s aim.
When the threat was levied a day later the USD hurriedly sold off and stocks bounced from a sell-off that started the day before with the CPI release. Trump did walk that back shortly after, allowing for a bit of recovery in the USD, but since then there’s been continued hints at a post-Powell Fed and there’s even been a referral to the Department of Justice to investigate Jerome Powell for lying under oath. Oh, and also there’s been several pointed accusations around the ongoing build-out of the new FOMC office in D.C., which has only served to keep the topic in the headlines.
In response the USD is selling off from the 98.98 level which is the 61.8% retracement of the 2021-2022 major move. Notably, the 50% mark of that same setup is what caught the highs in May at the 102.00 level in DXY.
U.S. Dollar Daily Price Chart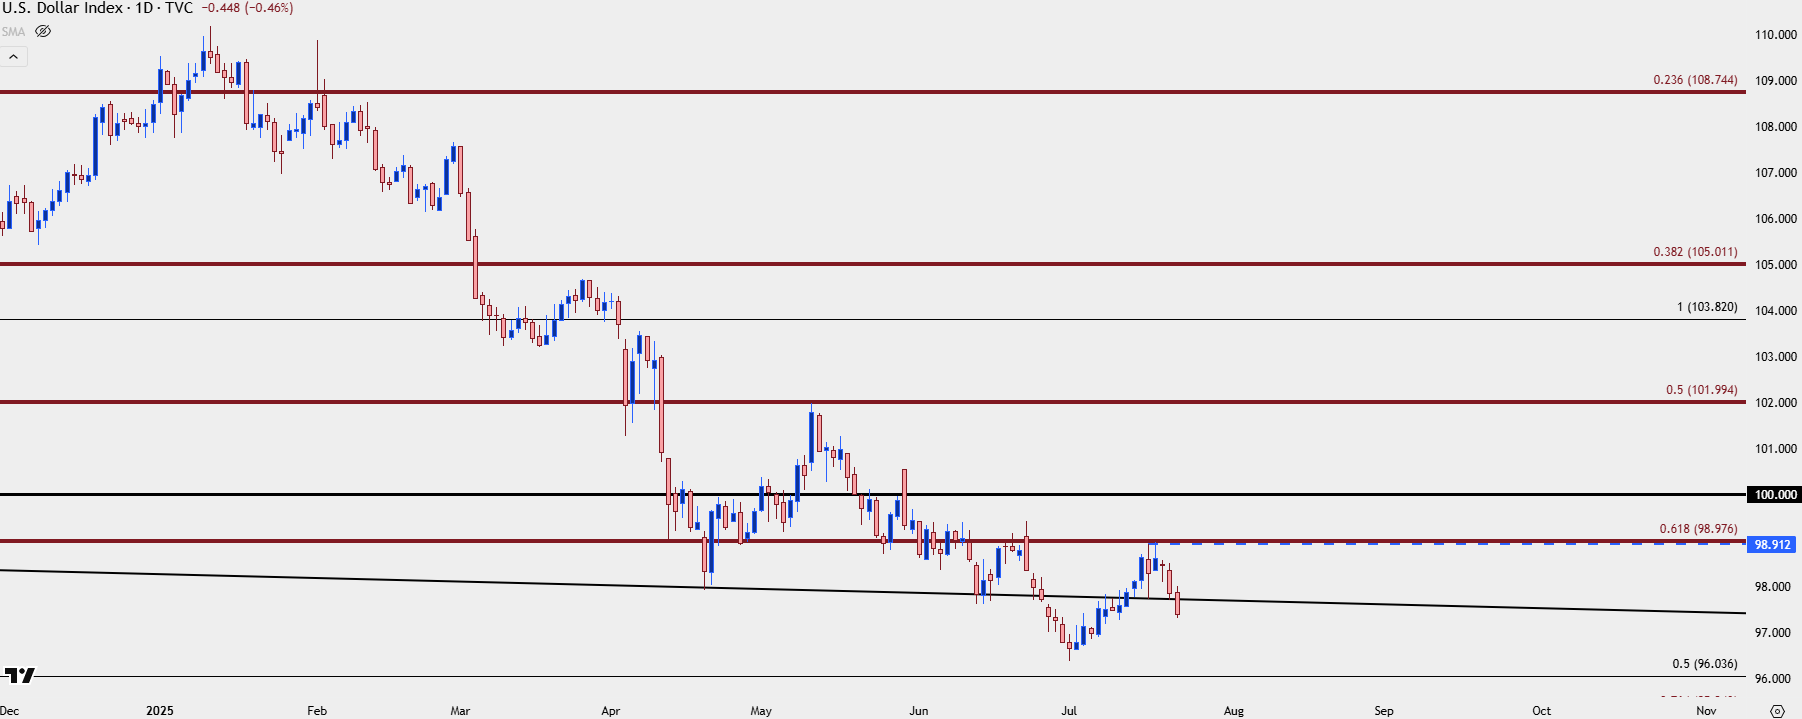
Chart prepared by James Stanley; data derived from Tradingview
GBP/USD
In that webinar last week, even with the USD breaking out, I didn’t want to take an imbalanced approach in the Dollar. I had looked at a setup in GBP/USD for USD-weakness scenarios and so far, the structure from that has held well.
The support zone that I looked at then was from 1.3395-1.3414, and that held the lows on Wednesday before leading into higher-lows on Thursday; and now that we have another push from USD-bears, GBP/USD is testing a breakout at the 1.3500 level.
GBP/USD Four-Hour Price Chart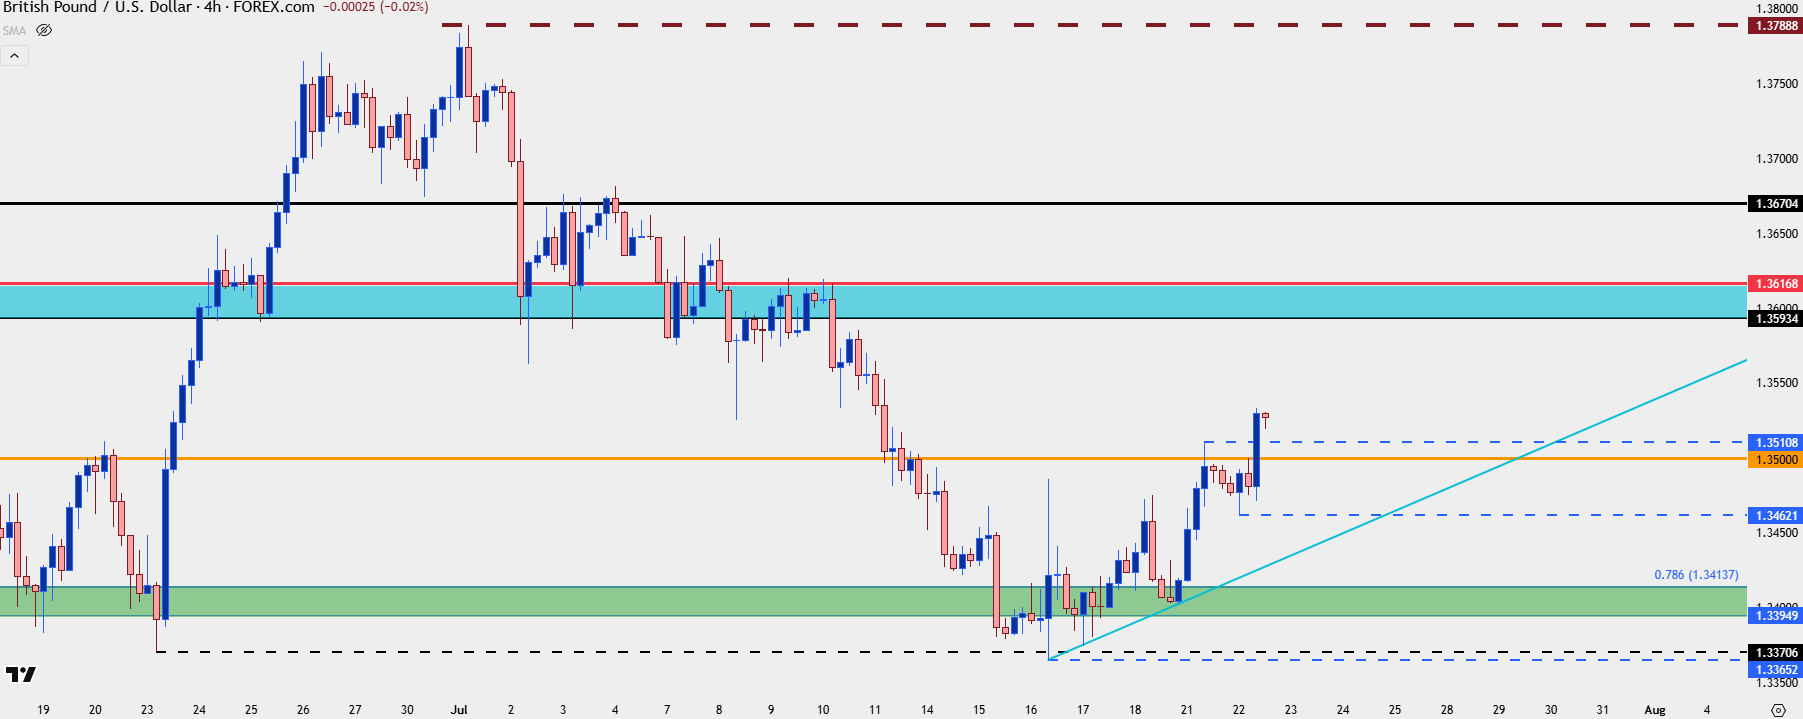
Chart prepared by James Stanley; data derived from Tradingview
EUR/USD
EUR/USD is currently testing a resistance level at the price of 1.1748, which is the 78.6% Fibonacci retracement of the 2021-2022 major move. This was resistance-turned-support-turned-resistance again around the Q2 close and Q3 open, and the move spark from support at the 1.1686 level which is the 76.4% retracement of the same major move.
As shared in the webinar, if we’re to see USD-strength on its way back, this is still my major FX market of choice, and a hold of that resistance or the 1.1788 level would be a key first step for setting up bears.
EUR/USD Daily Price Chart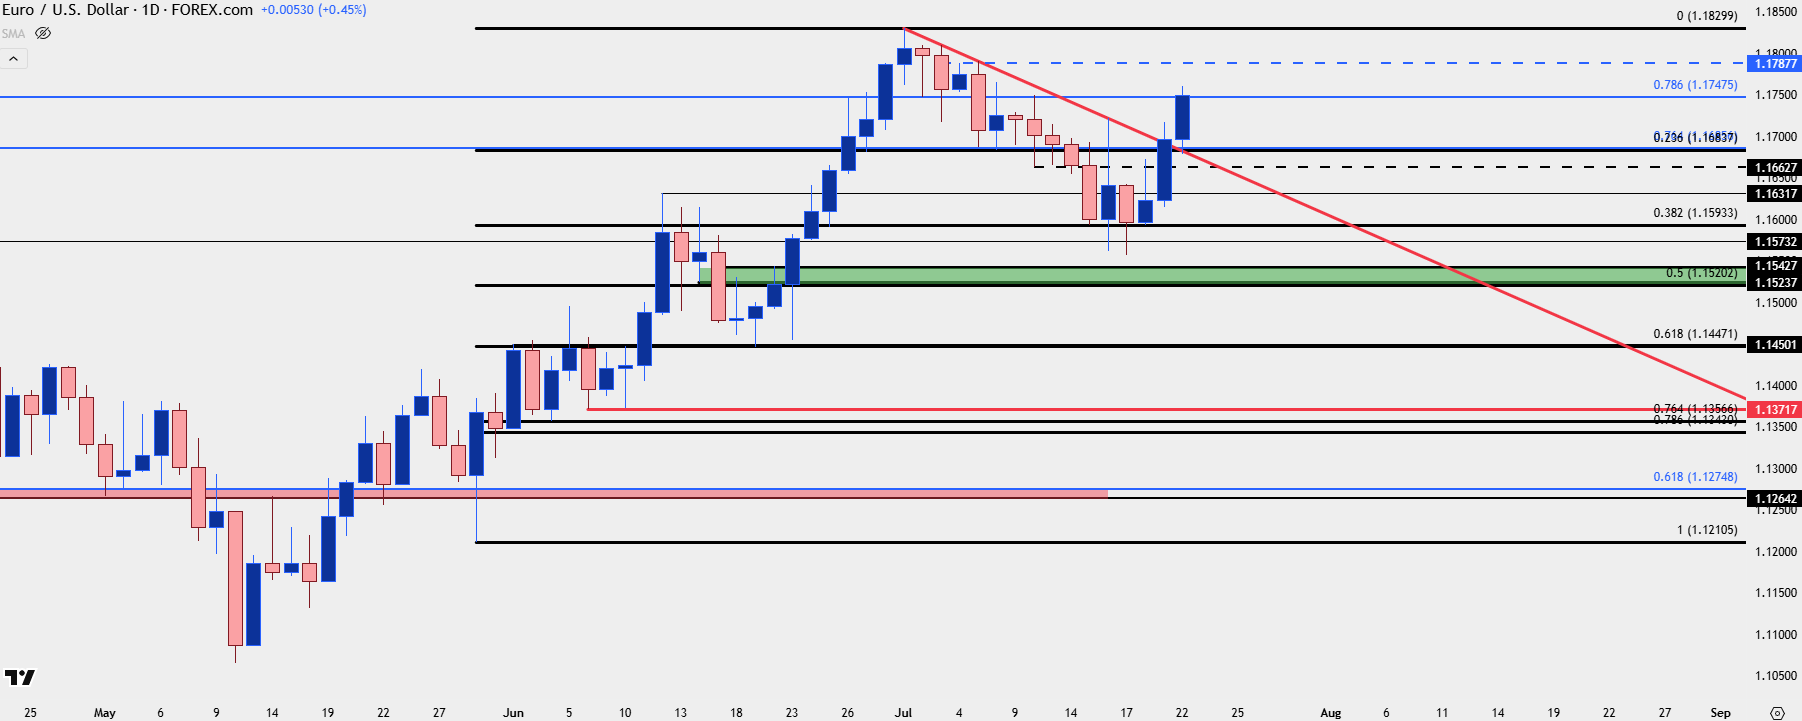
Chart prepared by James Stanley; data derived from Tradingview
USD/JPY
USD/JPY remains a massive macro item as the pair remains a little more than 40% above early-2021 levels, driven by the carry trade which served as a form of global leverage.
With indications of USD-weakness, particularly if President Trump is going to fire Powell in order to get a more-dovish Fed Chair installed, there could be motivation to unwind that carry trade which could bring on a risk-off move, similar to what showed last July. So far this week there’s been two harsh days of selling in USD/JPY after last week’s breakout failed. But, I still have a couple of key supports in-play at 146.54, 145.92 and then the major psychological level of 145.00.
If bears can sink below that, there may be signs of a larger tilt of USD-weakness, with both 142.50 and 140.00 as significant levels sitting below that more recent support structure in the pair.
USD/JPY Daily Price Chart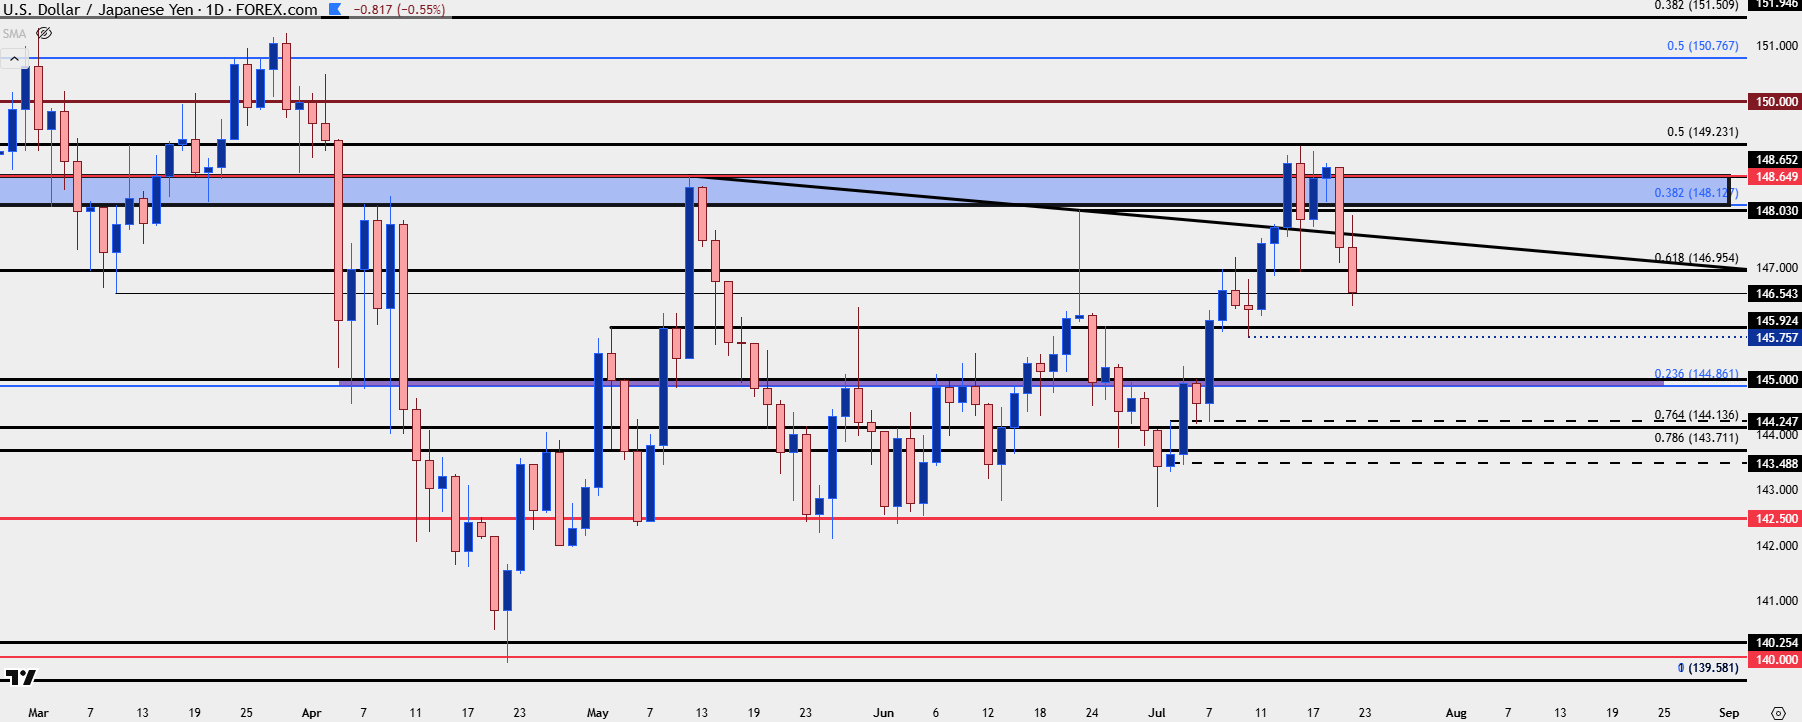
Chart prepared by James Stanley; data derived from Tradingview
--- written by James Stanley, Senior Strategist



The complete CFD trading experience
Award-winning platforms, competitive spreads, low commissions and dedicated support.
We live and breathe the markets and are dedicated to helping traders realise their ambitions as we continue to set the industry bar.
Economic calendar
Web Trader platform
Our sophisticated web-based platform is packed with features.
Related articles
FTSE, GBP/USD, EUR/GBP Forecast: What to expect from the Chancellor’s Budget
Chancellor John Healey will deliver his first UK budget, also the first under Prime Minister Andy Burnham, on Wednesday, October 28, usually around 12:30 GMT.

EUR/USD weekly outlook: FOMC and ECB to set the tone
The current backdrop is modestly bearish. On Friday, the EUR/USD closed modestly lower, down for the third consecutive day. The pair also posted a weekly decline after staging a modest recovery attempt in the previous week. Out of the past 8 weeks, the EUR/USD has fallen on 6 occasions. There is not much supporting factors for the single currency right now. So, the upside remains capped.


Gold Does Something it Hasn’t Done in a Year, is Larger Risk-Off Afoot?
With tech stocks getting hit harder last week there was collateral damage elsewhere, including gold as the metal closed below the $4k level for the week and that’s the first time that’s happened to spot gold in more than a year.
StoneX Europe Ltd may make third party material available on this website which may contain information included but not limited to the conditions of financial markets. The material is for information purposes only and does not contain, and should not be construed as containing, investment advice and/or investment recommendation and/or an investment research and/or an offer of or solicitation for any transactions in financial instruments; any decision to enter into a specific transaction shall be made by the client following an assessment by him/her of their situation.
StoneX Europe Ltd makes no representation or warranty and assumes no liability as to the accuracy or completeness of the information provided, nor any loss arising from any investment based on a recommendation, forecast or other information supplied. You should always seek independent advice as to your suitability to speculate in any related markets and your ability to assume the associated risks, if you are at all unsure. We are not under any obligation to update any such material. Any opinion made may be personal to the author and may not reflect the opinion of StoneX Europe Ltd.