









USD Soars, EUR/USD, AUD/USD, slide on ‘Pricey’ GDP Figures Ahead of PCE
I suspect traders will be particularly sensitive to any uptick in today's PCE inflation figures, in light of the higher prices seen in the revised GDP figures. And that could send AUD/USD lower for a sixth day and EUR/USD head for 103 while the USD continues its ascent.
Share this:

View related analysis:
- AUD/USD weekly outlook: Trimmed-mean CPI, PCE inflation on tap
- EUR/JPY Prods the Neckline of a Mammoth Bearish Reversal Pattern
- US dollar, yields dragged lower with consumer confidence, reviving rate-cut bets
View related analysis:
- AUD/USD weekly outlook: Trimmed-mean CPI, PCE inflation on tap
- EUR/JPY Prods the Neckline of a Mammoth Bearish Reversal Pattern
- US dollar, yields dragged lower with consumer confidence, reviving rate-cut bets
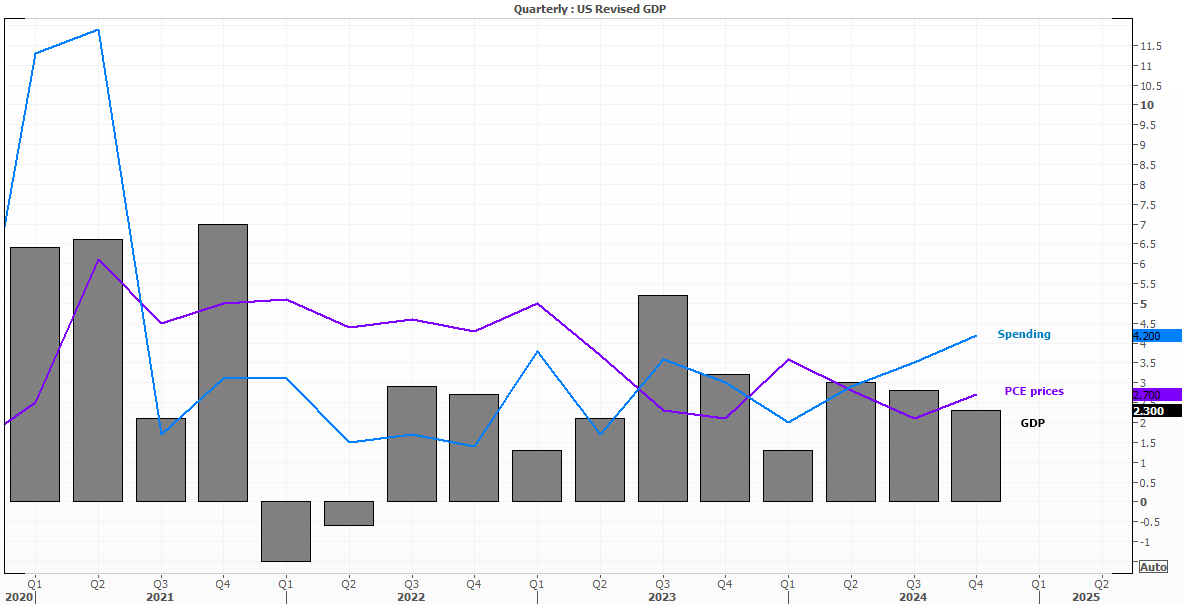
Revised GDP figures revealed that prices heated up in the fourth quarter, providing yet further evidence that inflation is returning before Trump’s tariffs have been implemented, let alone take effect. Core PCE was upwardly revised to 2.7% q/q from 2.4%, or 2.5% y/y from 2.5% y/y. This comes on the eve of a key inflation report from the US, which could easily see markets pour cold water on the single Fed cut that had been pricing in for June this week.
While growth remained unchanged at 2.3% q/q, it is a slowdown from the 3.1% printed in Q3. Elsewhere we have seen services PMI contract and consumer sentiment crash on concerns of tariffs and higher prices to fan fears of a recession – which itself is deflationary. This could prevent from conspiring hikes unless prices truly run away from them, but for now at least I think it is safe to bet that a cut is not a focus for the Fed at present.
The US dollar was the strongest FX major on Thursday, closing above the 107 handle and rallying in line with my bias outlined earlier this week. It’s 0.7% gain on Thursday also marks its best day since January 2nd to extend gains after finding support at a long-term 38.2% Fibonacci ratio. It appears to be breaking out of a rising wedge pattern, which suggests a target around its 109.62 base.
- The S&P 500 fell sharpy in the final ours of trade to close -1.5% lower, beneath its 100-day EMA, during its most volatile day of the year (daily range of 2.3%)
- This saw EUR/USD suffer the predicable fate of falling -0.7% to the 1.04% handle amid its second worst day of the year
- USD/JPY broke above 105 once more and looks set to extend gains over the near term.
- AUD/USD was lower for a fifth day, marking its worst day of the year with its -1.2% decline.
- The US 2-year yield teased a break of its November low for the second consecutive day. If this is pending a breakout from a multi-month top, a measured move lands around 3.7%, assuming the yield falls beneath the 4% figure
The question now is whether we’ll see an upside surprise in today’s core PCE figure for February. Given that Trump’s tariffs appear to be going ahead as scheduled on March 4th and inflationary pressures are already resurfacing, it might only require an uptick on the PCE or super core inflation figures for the USD to catch another strong bid and see the odds of a June cut rapidly diminish.
Economic events in focus (AEDT)
- 10:30 – Tokyo CPI
- 10:50 – Japanese industrial production, retail sales
- 11:30 – Australian housing credit
- 13:00 – New Zealand M3 money supply
- 18:00 – BOW MPC member Ramsden Speaks
- 20:00 – German Sate CPI
- 00:00 – German CPI
- 00:30 – US core PCE
AUD/USD technical analysis:
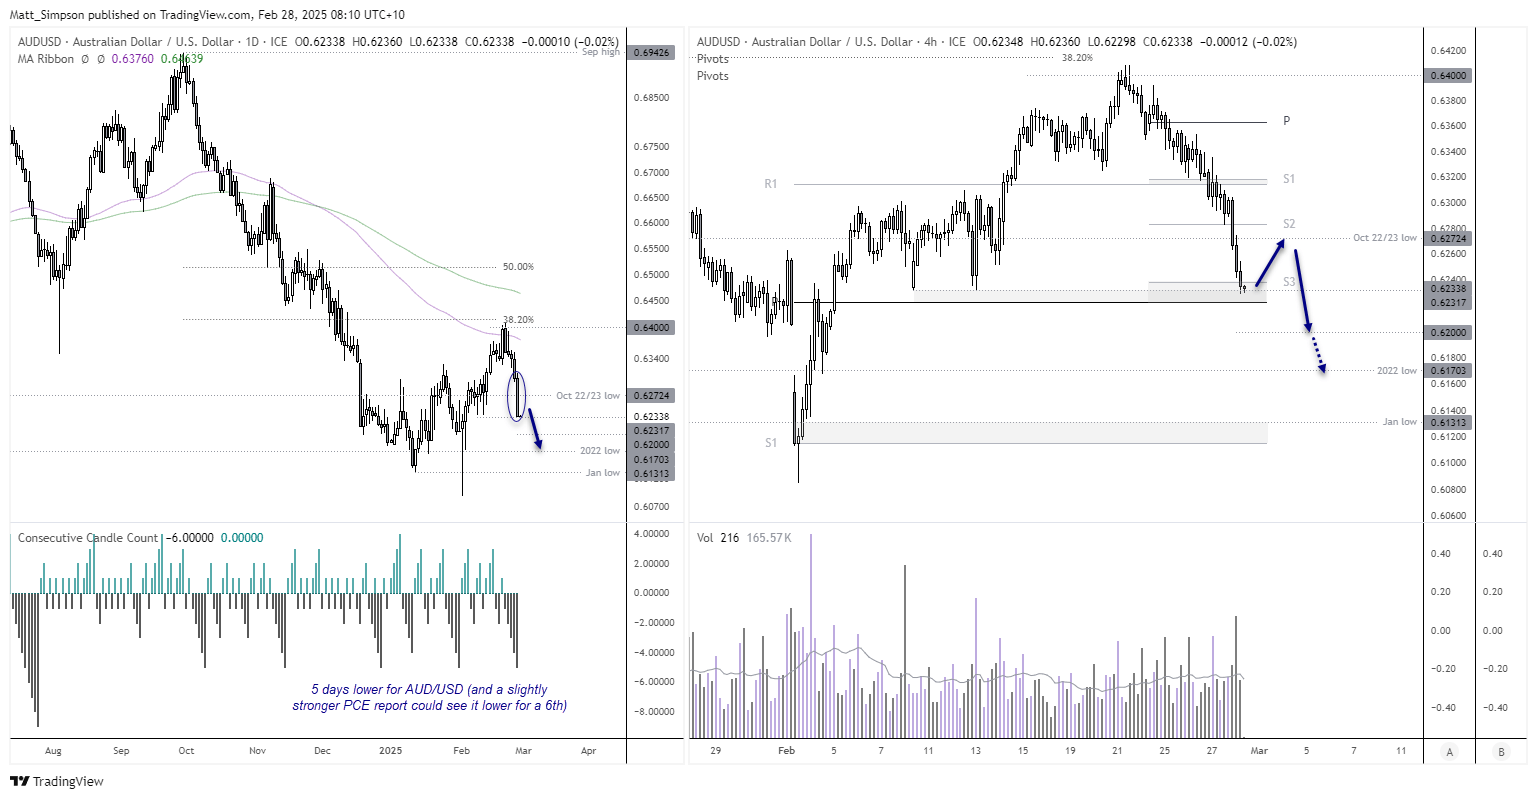
Not only did AUD/USD close lower for a fifth day, but it was its most bearish day of the year and prices cut through the October low lie butter. Should we see a hot PCE report today, a sixth day low could be expected. 62c is the next likely support level, a break beneath which brings the 2022 low into focus for bears.
However, as we saw an extended move lower on Thursday and prices are holding above the monthly pivot point, cycle lows and just beneath the weekly S3 pivot, perhaps a minor bounce could be due in Asia. But given the potential for the US dollar to extend gains, traders may feel compelled to fade into rallies on AUD/USD.
-- Written by Matt Simpson
Follow Matt on Twitter @cLeverEdge
How to trade with City Index
You can trade with City Index by following these four easy steps:
- Open an account, or log in if you’re already a customer
• Open an account in the UK
• Open an account in Australia
• Open an account in Singapore
- Search for the market you want to trade in our award-winning platform
- Choose your position and size, and your stop and limit levels
- Place the trade
Related tags:


The complete CFD trading experience
Award-winning platforms, competitive spreads, low commissions and dedicated support.
We live and breathe the markets and are dedicated to helping traders realise their ambitions as we continue to set the industry bar.
Economic calendar
Web Trader platform
Our sophisticated web-based platform is packed with features.
Related articles

USD/JPY weekly outlook: Quarter turn scrambles rates regime
USD/JPY’s tight relationship with front-end US rates broke down sharply last week, but quarter-turn flows and positioning suggest the disconnect may prove temporary.


USD/CAD forecast: rally could accelerate above June highs at 1.4250
USD/CAD recovered quickly after weaker US jobs data, keeping the bullish trend in focus. A move above the June highs could accelerate the rally as inflation keeps the Fed under pressure.


USD Sets Fresh Yearly High as EUR/USD Drops Dramatically, USD/JPY Stable
Well, it was a week of USD strength that wasn’t entirely pushed by USD/JPY, as a strong sell-off in EUR/USD has pushed the major pair to its most oversold state in a decade.
StoneX Europe Ltd may make third party material available on this website which may contain information included but not limited to the conditions of financial markets. The material is for information purposes only and does not contain, and should not be construed as containing, investment advice and/or investment recommendation and/or an investment research and/or an offer of or solicitation for any transactions in financial instruments; any decision to enter into a specific transaction shall be made by the client following an assessment by him/her of their situation.
StoneX Europe Ltd makes no representation or warranty and assumes no liability as to the accuracy or completeness of the information provided, nor any loss arising from any investment based on a recommendation, forecast or other information supplied. You should always seek independent advice as to your suitability to speculate in any related markets and your ability to assume the associated risks, if you are at all unsure. We are not under any obligation to update any such material. Any opinion made may be personal to the author and may not reflect the opinion of StoneX Europe Ltd.