







USD/CAD Eyes 1.3740 and Nasdaq Tests 18,000 on Shaken US Confidence
Confidence in the US Dollar continues to erode as Trump escalates his attacks on the Federal Reserve amid intensifying trade tensions with China. As a result, USDCAD has slipped below 1.38, while the Nasdaq hovers around the 18,000 level.
Share this:

Key Events to Watch:
- US Dollar Index (DXY) drops to 98 amid Trump threats to the Fed
- Tesla earnings on Tuesday may further fuel stock market volatility
- IMF Spring Meetings – potential signals on global trade and monetary policy
- China threatens retaliation against countries aligning with Trump’s economic stance
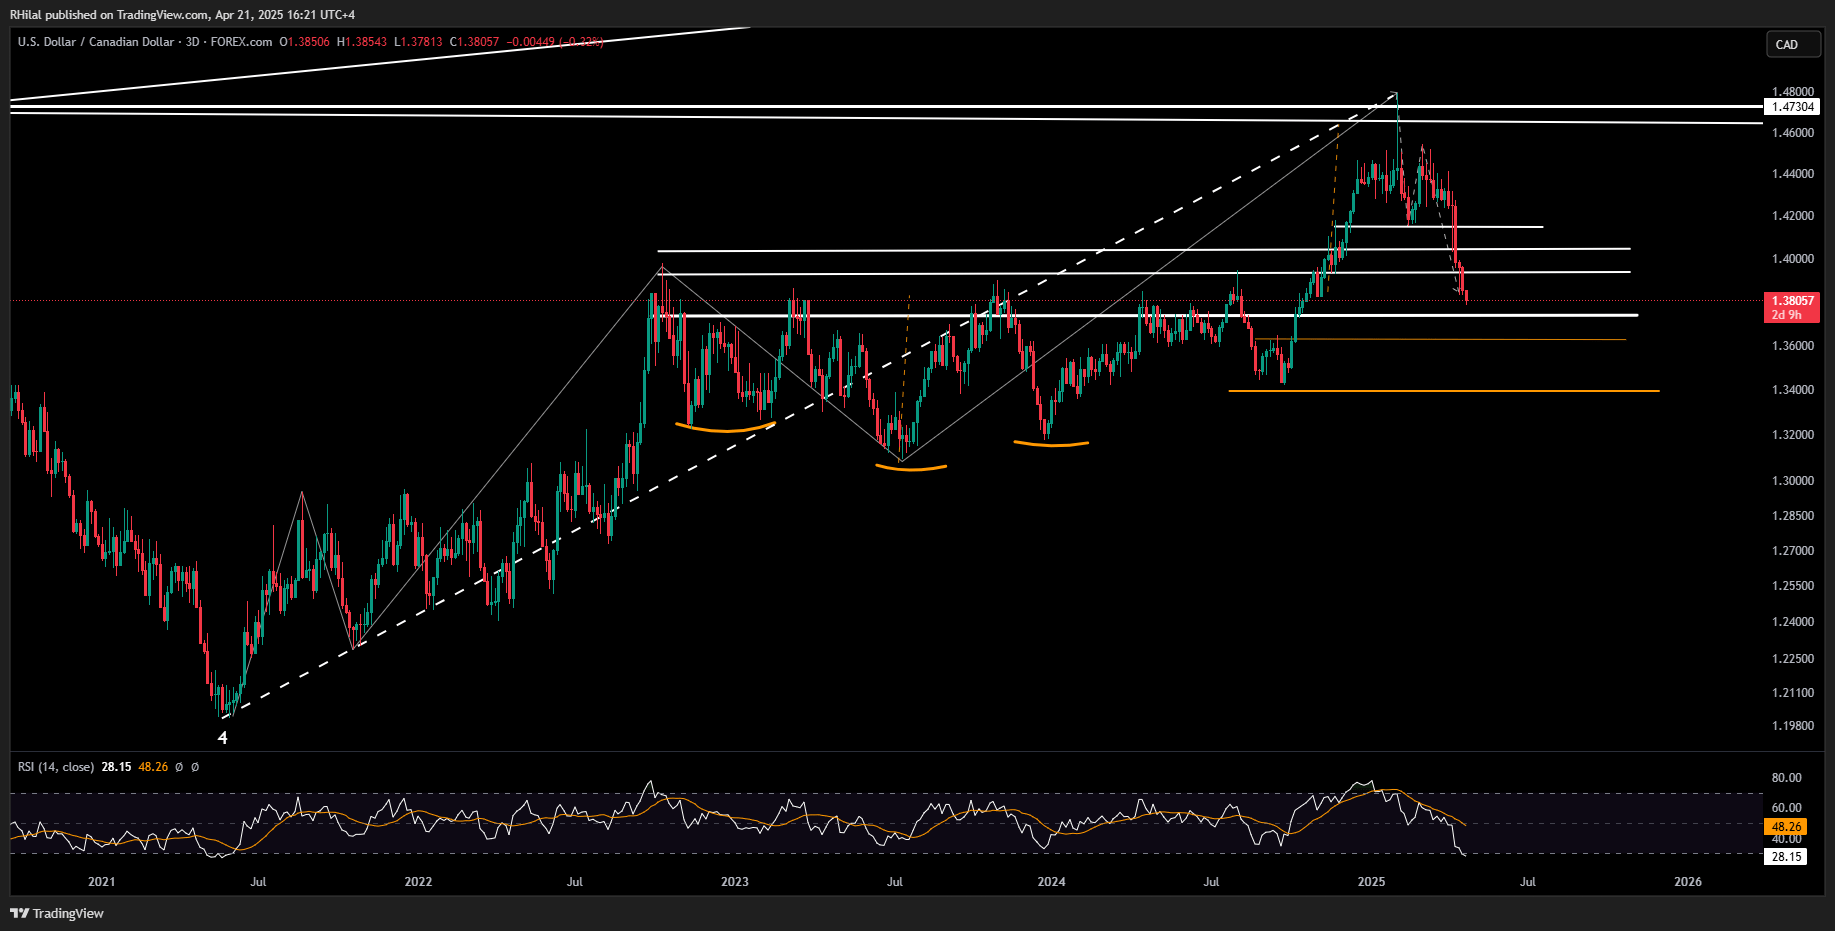
USDCAD Weekly Chart – Log Scale
Source: TradingView
In line with the broader weakness in the US Dollar Index (DXY), which is currently testing the key 98 support level, USDCAD is eyeing a critical confluence zone near 1.3740, supported by Fibonacci levels. This zone aligns with the 1.272 Fibonacci extension drawn from the three-wave correction since the February 2025 high, through the February 2025 low, and back to the March 2025 high.
Additionally, from a broader perspective, this area coincides with the 0.618 Fibonacci retracement of the uptrend extending from the May 2021 lows to the February 2025 highs. If the pair drops further, the next support levels to monitor are 1.3570 and 1.3400. On the upside, a recovery above 1.3740 could open the door for gains toward 1.3940, 1.4040, and 1.4140.
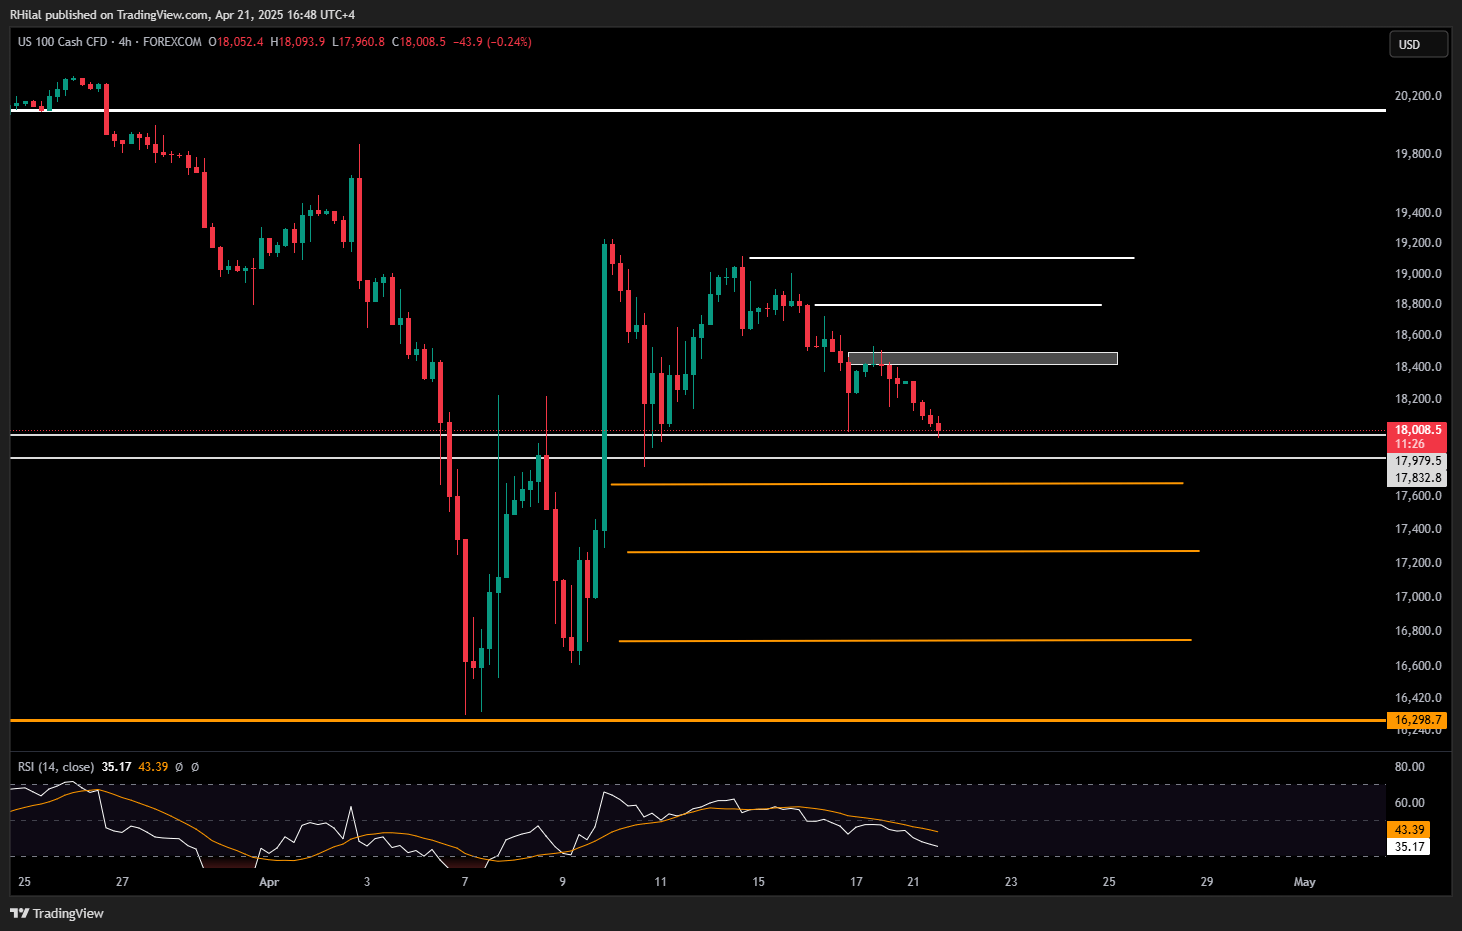
Nasdaq Outlook – 4H Time Frame (Log Scale)
Source: TradingView
US indices are trending lower amid continued uncertainty, with the Nasdaq hovering just above 18,000. Key support zones lie between 17,900 and 17,600. A break below these levels may confirm a shift toward a more bearish structure, with potential downside targets at 17,200, 16,700, and 16,300.
In a worst-case risk scenario, a drop below 16300 may extend another 1,000-point drop towards 15,000. However, if Nasdaq holds above 18,000 and is supported by strong fundamentals, we could see a bounce toward 18,500, 18,800, and 19,200. That would bring it back to a key resistance zone, where the market must decide between resuming a broader uptrend beyond 20,000 or facing another correction.
Written by Razan Hilal, CMT
Follow on X @Rh_waves



The complete CFD trading experience
Award-winning platforms, competitive spreads, low commissions and dedicated support.
We live and breathe the markets and are dedicated to helping traders realise their ambitions as we continue to set the industry bar.
Economic calendar
Web Trader platform
Our sophisticated web-based platform is packed with features.
Related articles

USD/MXN Analysis: Is Super Peso Starting to Fade?
Over recent trading sessions, the Mexican peso has continued to show signs of weakness against the U.S. dollar. This can already be seen in USD/MXN, which has gained more than 1.7% over the last three sessions, highlighting sustained buying pressure in favor of the dollar in the short term.


Nasdaq 100 Forecast: NDX slips as Treasury yields keep rising
U.S. stocks are falling at the start of Q4, as gains in software stocks offset concerns over soaring Treasury yields. U.S. Treasury yields continue to rise, with the 10-year yield up 2 basis points at 5.31% and the 30-year at 5.66%, multi-decade highs.


US Dollar Technical Outlook: DXY Bulls Meet Resistance at Yearly Highs 10 1 2026
The U.S. Dollar has held firm despite fading Fed hike bets, but Friday’s payrolls could test the rally’s staying power.

StoneX Europe Ltd may make third party material available on this website which may contain information included but not limited to the conditions of financial markets. The material is for information purposes only and does not contain, and should not be construed as containing, investment advice and/or investment recommendation and/or an investment research and/or an offer of or solicitation for any transactions in financial instruments; any decision to enter into a specific transaction shall be made by the client following an assessment by him/her of their situation.
StoneX Europe Ltd makes no representation or warranty and assumes no liability as to the accuracy or completeness of the information provided, nor any loss arising from any investment based on a recommendation, forecast or other information supplied. You should always seek independent advice as to your suitability to speculate in any related markets and your ability to assume the associated risks, if you are at all unsure. We are not under any obligation to update any such material. Any opinion made may be personal to the author and may not reflect the opinion of StoneX Europe Ltd.