






USD/CAD Outlook: How Long Will Canadian Dollar's Neutrality Last?
USD/CAD has been showing neutral price action in the short term. Over the last five sessions, price fluctuations have barely reached a 0.5% variation, as the pair continues hovering around a key barrier near the 1.43289 level.
Share this:

USD/CAD has been showing neutral price action in the short term. Over the last five sessions, price fluctuations have barely reached a 0.5% variation, as the pair continues hovering around a key barrier near the 1.43289 level. This calm occurs amid new developments regarding the trade war and recent moves from central banks.
Trump’s Tariffs
For over a month, the Trump administration has firmly pointed to April 2 as the date when all previously announced tariffs will officially take effect. This includes a 25% tariff on goods from Canada and Mexico, measures that have been mentioned repeatedly in recent weeks.
However, once again, the U.S. President has shown some flexibility, stating that tariffs may not be enforced on that date, offering additional negotiation time to the affected countries. He also mentioned the potential implementation of new tariffs on products from other countries, adding further uncertainty to the outlook.
In short, it is still unclear whether Canada and Mexico will face tariffs at the beginning of April. This has given the market a temporary breather, especially for the Canadian dollar, which has avoided weakening in the short term. However, if the White House resumes a tougher stance, downward pressure on the CAD could return, potentially driving USD/CAD higher through renewed bullish momentum on the U.S. dollar.
Central Banks
In recent weeks, the Bank of Canada (BoC) and the Federal Reserve (FED) have adopted contrasting positions. On March 12, the BoC took a dovish stance, stating that economic uncertainty justifies lower rates in the medium term.
By contrast, during its March 20 meeting, the FED indicated that inflation remains well above the 2% target, choosing to keep rates unchanged at 4.25% – 4.5%, reflecting a firm but neutral position.
Currently, the interest rate gap between the two central banks stands at 4.5% for the FED and 2.75% for the BoC, which represents a notable divergence in monetary policy decisions.
BOC vs. FED: Rate Comparison
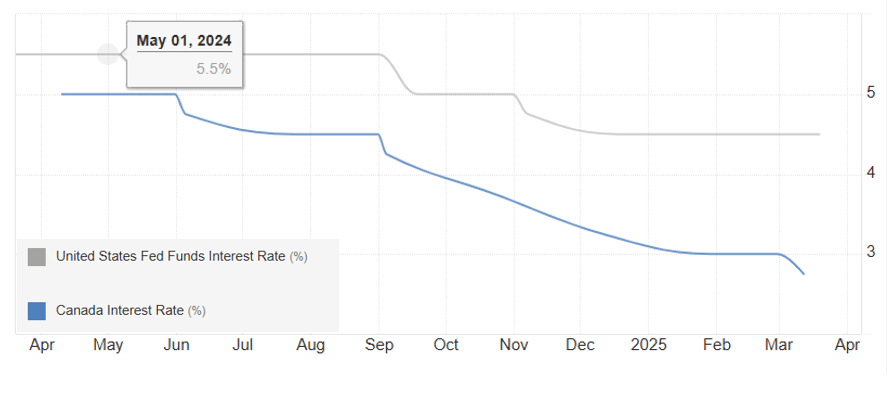
Source: Tradingeconomics
Looking ahead to the May 7 meeting, the FED is expected to keep rates stable, with a probability of 89.8%, according to CME Group data. This reinforces the FED’s neutral tone for the coming months.
FED Rate Probability Table – CME
Source: CMEGroup
This rate gap and policy divergence could be crucial for USD/CAD. A higher and stable rate in the U.S. could continue to attract capital to U.S. fixed-income securities, reducing the appeal of Canadian assets. As a result, demand for the U.S. dollar could increase, limiting the strength of the Canadian dollar and sustaining bullish pressure on USD/CAD.
USD/CAD Technical Outlook
Source: StoneX, Tradingview
- Broad Sideways Range: Since December 2024, USD/CAD has remained within a well-defined sideways range, with resistance at 1.45255 and support at 1.41829. Currently, the price is fluctuating near the middle of the range, and the strength of recent movements has been low making a short-term breakout unlikely. If neutrality continues, this lateral channel may remain the dominant formation in the coming sessions.
- Indicator Neutrality:
- ADX: The ADX line is showing steady oscillations near the 20 level, indicating a lack of clear trend in the last 14 trading sessions.
- TRIX: Similarly, the TRIX line remains near the neutral level at 0, reflecting uncertainty in market direction based on recent moving average data.
Both indicators confirm that price neutrality remains intact, which could be a key factor in maintaining the current sideways channel.
Key Levels:
- ADX: The ADX line is showing steady oscillations near the 20 level, indicating a lack of clear trend in the last 14 trading sessions.
- 1.45255 – Major Resistance: This is the upper boundary of the sideways range. A return to this level could revive a medium-term uptrend, sustaining bullish pressure.
- 1.43289 – Near-Term Barrier: This level aligns with the medium-term trendline and the 25- and 50-period moving averages. If the price remains near this zone, the bullish trend could be at risk, reinforcing the sideways range as the dominant formation.
- 1.41829 – Key Support: This is the lowest level reached in recent months. A break below this zone could trigger significant selling pressure, potentially ending the current bullish structure.
Written by Julian Pineda, CFA – Market Analyst
Related tags:




The complete CFD trading experience
Award-winning platforms, competitive spreads, low commissions and dedicated support.
We live and breathe the markets and are dedicated to helping traders realise their ambitions as we continue to set the industry bar.
Economic calendar
Web Trader platform
Our sophisticated web-based platform is packed with features.
Related articles

Canadian Dollar Technical Outlook: USD/CAD Seven-Day Rally Tests Major Resistance 9 29 2026
USD/CAD is pressing into a major technical barrier after an extended advance, raising the risk for price inflection as momentum stretches.


USD/CAD and USD/MXN Q4 2026 Outlook: Will the U.S. Dollar Dominate North America Again?
The final stretch of 2026 is approaching, and North America's major currencies have begun to show a shift in the strength dynamics seen earlier in the year. New expectations of a more aggressive monetary policy stance, particularly in the United States, could be significantly reshaping the outlook for the region. At the same time, this backdrop, combined with potential trade tensions across North America, may become one of the most important drivers of currency performance in the months ahead.

USD/CAD Analysis: Is the Canadian Dollar Running Out of Support?
A new trading week is underway, and the Canadian dollar continues to show signs of weakening momentum. This can be seen in recent USD/CAD price action, with the pair gaining nearly 0.7% over the last four trading sessions.
StoneX Europe Ltd may make third party material available on this website which may contain information included but not limited to the conditions of financial markets. The material is for information purposes only and does not contain, and should not be construed as containing, investment advice and/or investment recommendation and/or an investment research and/or an offer of or solicitation for any transactions in financial instruments; any decision to enter into a specific transaction shall be made by the client following an assessment by him/her of their situation.
StoneX Europe Ltd makes no representation or warranty and assumes no liability as to the accuracy or completeness of the information provided, nor any loss arising from any investment based on a recommendation, forecast or other information supplied. You should always seek independent advice as to your suitability to speculate in any related markets and your ability to assume the associated risks, if you are at all unsure. We are not under any obligation to update any such material. Any opinion made may be personal to the author and may not reflect the opinion of StoneX Europe Ltd.