








USD/JPY, Nasdaq Outlook: Trade Talks Meet Resistance Zones
USDJPY, Nasdaq Outlook: U.S.-China trade negotiations are gaining traction, but as optimism grows, markets are simultaneously pressing against major resistance zones — raising the stakes for a sustained breakout.
Share this:

Key Events
- U.S.–China tariff talks took a positive turn over the weekend in Geneva, keeping risk assets near key resistance levels
- U.S. indices are trading at "liberation day" zones, eyeing a breakout if trade resolutions are confirmed
- U.S. CPI later this week could introduce sharp volatility, especially if trade optimism fades
Trade Talks: Progress, But No Deal Yet
Despite signals of progress in U.S.–China negotiations, no formal agreement has emerged. Both economies are operating at restrained levels reminiscent of 2020, and discussions remain centered on sticking points — including U.S. tariffs on Chinese goods and China's export controls on rare earth minerals.
Markets are largely positioned for upside across oil, equities, and the U.S. dollar, betting on a resolution. However, the final steps could prove challenging, with investors wary of any breakdown in talks. As China’s trade representative Li Chenggang noted by Bloomberg, “As we say back in China, if the dishes are delicious, the timing doesn’t matter. Whenever it gets released, it will be good news for the world.”
That optimism is echoed in the charts, where U.S. indices are hovering near major resistance — including the neckline of double top formations seen from December 2024 to February 2025.
Nasdaq, Dow, SPX500 – Weekly Time Frame – Log Scale
Source: Tradingview
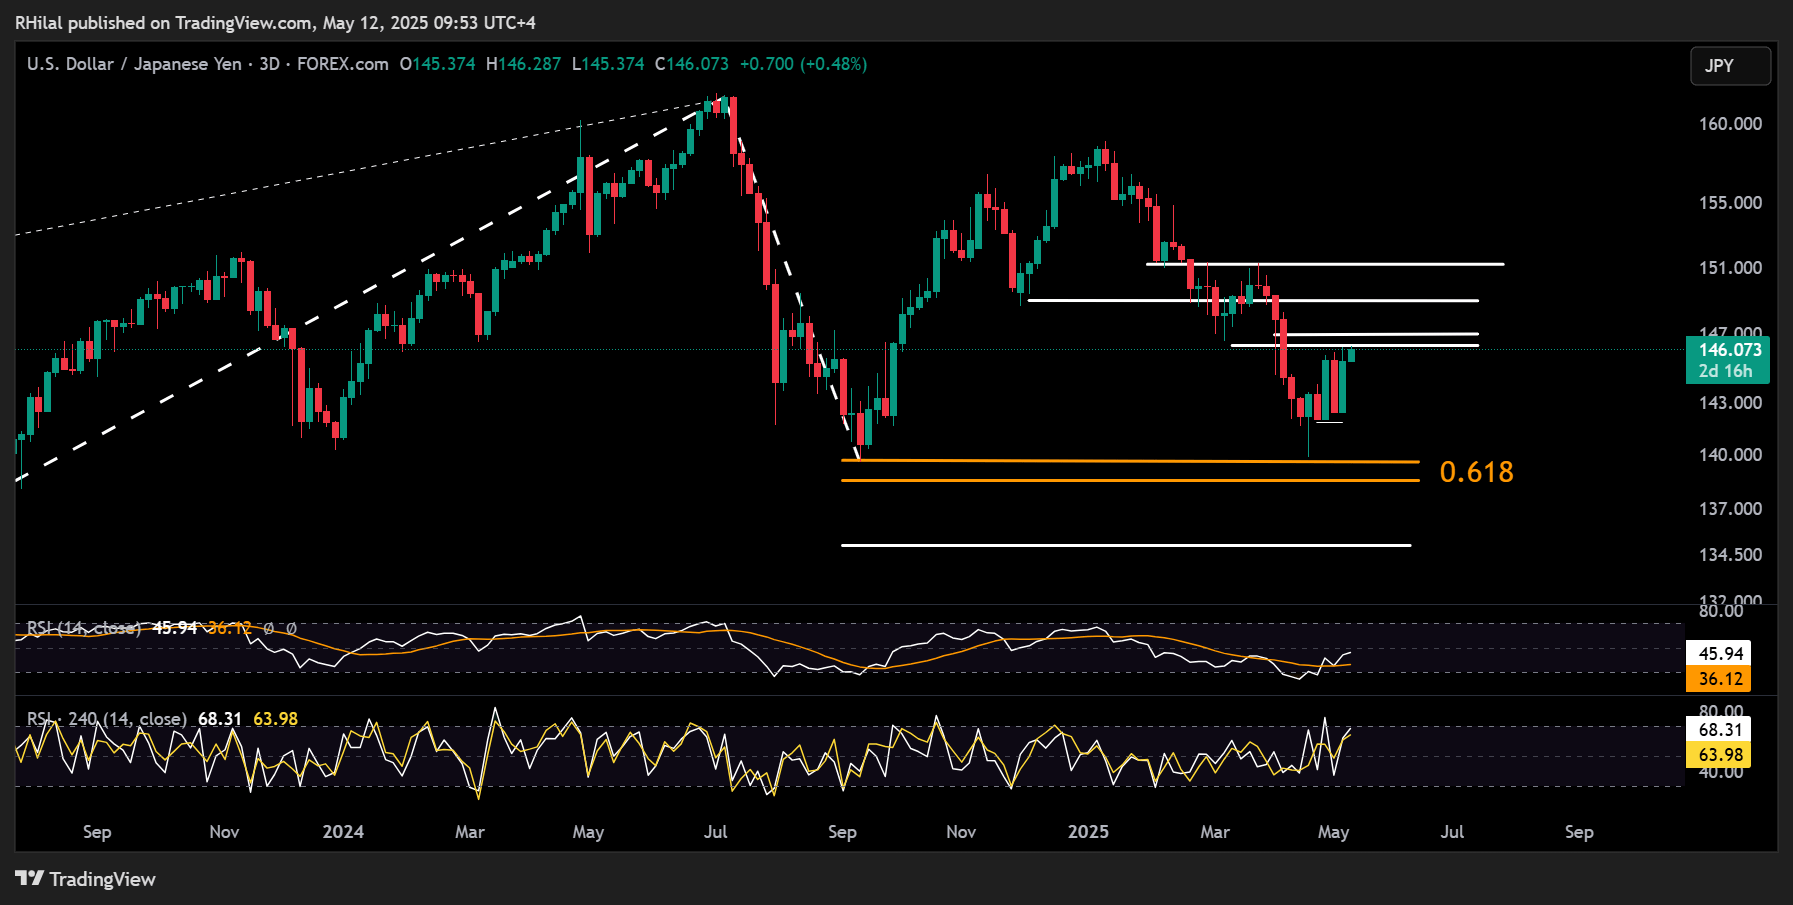
USDJPY Outlook: 3-Day Time Frame – Log Scale
Source: Tradingview
The USDJPY is holding a modest rebound just below the March 2025 low at 146.30, supported by dollar stability and trade optimism. This level is technically significant — it coincides with the 0.272 Fibonacci retracement of the January–April 2025 downtrend and momentum indicators showing neutral-to-overbought conditions on the 3day and 4 hour charts.
Upside Scenario: A clean break above 146.30 may extend gains toward 146.90, 149.00, and 151.30.
Downside Scenario: Failure to hold 146.30 could lead to a pullback to 144.00, 142.00, and 139.00, deepening the bearish case into the second half of 2025.
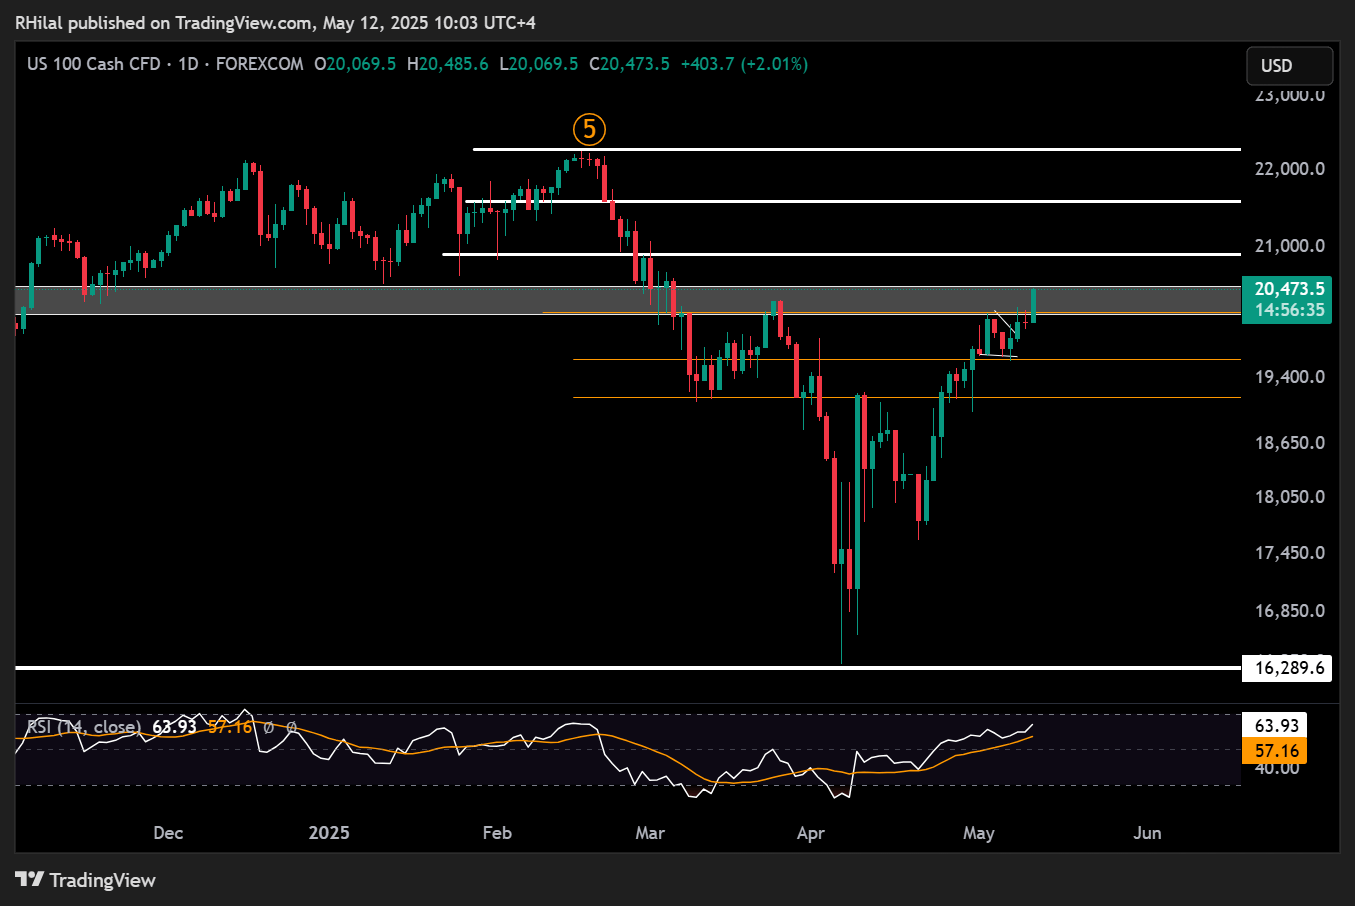
Nasdaq Outlook: Weekly Time Frame – Log Scale
Source: Tradingview
As shown in the indices chart above, price action is hovering near the neckline of a well-defined double top pattern, formed between December 2024 and February 2025 across the Dow, SPX500, and Nasdaq. This reinforces a key resistance zone that could either validate a more sustainable bullish outlook into 2025 — or trigger another correction if rejected.
Nasdaq Upside Scenario: A confirmed hold above 20,530 may extend gains toward 20,900, 21,500, and 22,200.
Downside Scenario: A pullback below 20,500 could find support at 20,200, 19,600, and 19,170, respectively.
Written by Razan Hilal, CMT
Follow on X: @Rh_waves
Related tags:




The complete CFD trading experience
Award-winning platforms, competitive spreads, low commissions and dedicated support.
We live and breathe the markets and are dedicated to helping traders realise their ambitions as we continue to set the industry bar.
Economic calendar
Web Trader platform
Our sophisticated web-based platform is packed with features.
Related articles

USD/JPY Update: Can the Japanese Yen Sustain Its Recovery?
Short-term price action around the Japanese yen has started to show some relative improvement over recent sessions. This can be seen in the recent performance of USD/JPY, which has now recorded three consecutive daily declines in favor of the Japanese currency, resulting in a depreciation of roughly 0.35% over the period.


Nasdaq 100 forecast: US tech stocks extend decline as AI concerns intensify
Following the CPI-related drop yesterday, Nasdaq 100 futures have fallen further following a weak handover from Asian markets overnight. US stocks came under intense pressure after a hotter-than-expected inflation report revived bets on further Federal Reserve rate hikes and sent Treasury yields and the dollar higher. While both the dollar and yields subsequently dropped back to pre-CPI levels and more in the case of yields, the Nasdaq has failed to respond positively as concerns over AI trade remained.


Nasdaq 100 selloff has a twist we haven't seen this year
We've seen three substantial Nasdaq 100 selloffs this year, only for buyers to return. But the Treasury market's reaction to the latest decline is very different, raising questions about whether this is another temporary scare or something more substantial.
StoneX Europe Ltd may make third party material available on this website which may contain information included but not limited to the conditions of financial markets. The material is for information purposes only and does not contain, and should not be construed as containing, investment advice and/or investment recommendation and/or an investment research and/or an offer of or solicitation for any transactions in financial instruments; any decision to enter into a specific transaction shall be made by the client following an assessment by him/her of their situation.
StoneX Europe Ltd makes no representation or warranty and assumes no liability as to the accuracy or completeness of the information provided, nor any loss arising from any investment based on a recommendation, forecast or other information supplied. You should always seek independent advice as to your suitability to speculate in any related markets and your ability to assume the associated risks, if you are at all unsure. We are not under any obligation to update any such material. Any opinion made may be personal to the author and may not reflect the opinion of StoneX Europe Ltd.