





USD/JPY Tests Wedge Resistance, is the Post-FOMC Bounce Finished?
USD/JPY has continued to bounce after the failed breakdown at 140.00 to start last week. But after trendline resistance has come into play, are sellers starting to take another swing?
Share this:

USD/JPY Talking Points:
- It’s been a strong past week for USD/JPY, even with a dimmer fundamental backdrop for the pair.
- USD/JPY tested below 140.00 for the first time in over a year to start last week, but that’s where sellers stalled and buyers took over. The pair set a higher-low after the FOMC rate decision and continued to push, all the way into today after which resistance showed at a descending trendline taken from mid-August and September swing highs.
- I’ll be going over these setups in the weekly webinar, held each Tuesday at 11am ET: Click here for registration information.
It’s been a busy year for USD/JPY and the final quarter of 2024 looks to be setting up for even more volatility.
Coming into the year one of the most ideal carry trade scenarios had held in the pair for the past few years. There was continued resistance at the 150-151.95 area but, given the November-December pullback last year, with support setting at the Fibonacci level of 140.30 in late-December, there was still scope for continuation.
The problem was that the Fed was highly expected to begin cutting rates in 2024 and the BoJ was potentially even moving towards a more-hawkish stance. That threatened to up-end the fundamental drive that had pushed USD/JPY from sub-103 at the 2021 open.
That 151.95 level was soon in-play in Q1 and it helped to hold the highs into the end of the quarter, even after the Bank of Japan began hiking rates in a very slight and careful manner. But it was April 10th that the pair broke out as an above-expected US CPI print brought on fears that the Fed may not be cutting soon. With that resistance so well-defined there were likely a lot of stops sitting just above. And stops on short positions are buy-to-cover logic, which adds demand into the market. Once that price was traded over a strong breakout took hold, and price continued to run until a test of the 160.00 handle.
At that point the BoJ stepped in to intervene, but the impact was limited. Price did drop for a little more than a week but support eventually showed at that same 151.95 level that had been defended before. And with US data looking strong and the Fed not yet ready to cut, price accelerated higher, pushing right back to 160 and this time, it didn’t stop. That breakout ran into early-July at which point the BoJ had to step in again.
It was July 11th when a below-expected US CPI report was released and with the help of intervention from the Bank of Japan, an aggressively bearish move showed up.
USD/JPY Weekly Chart
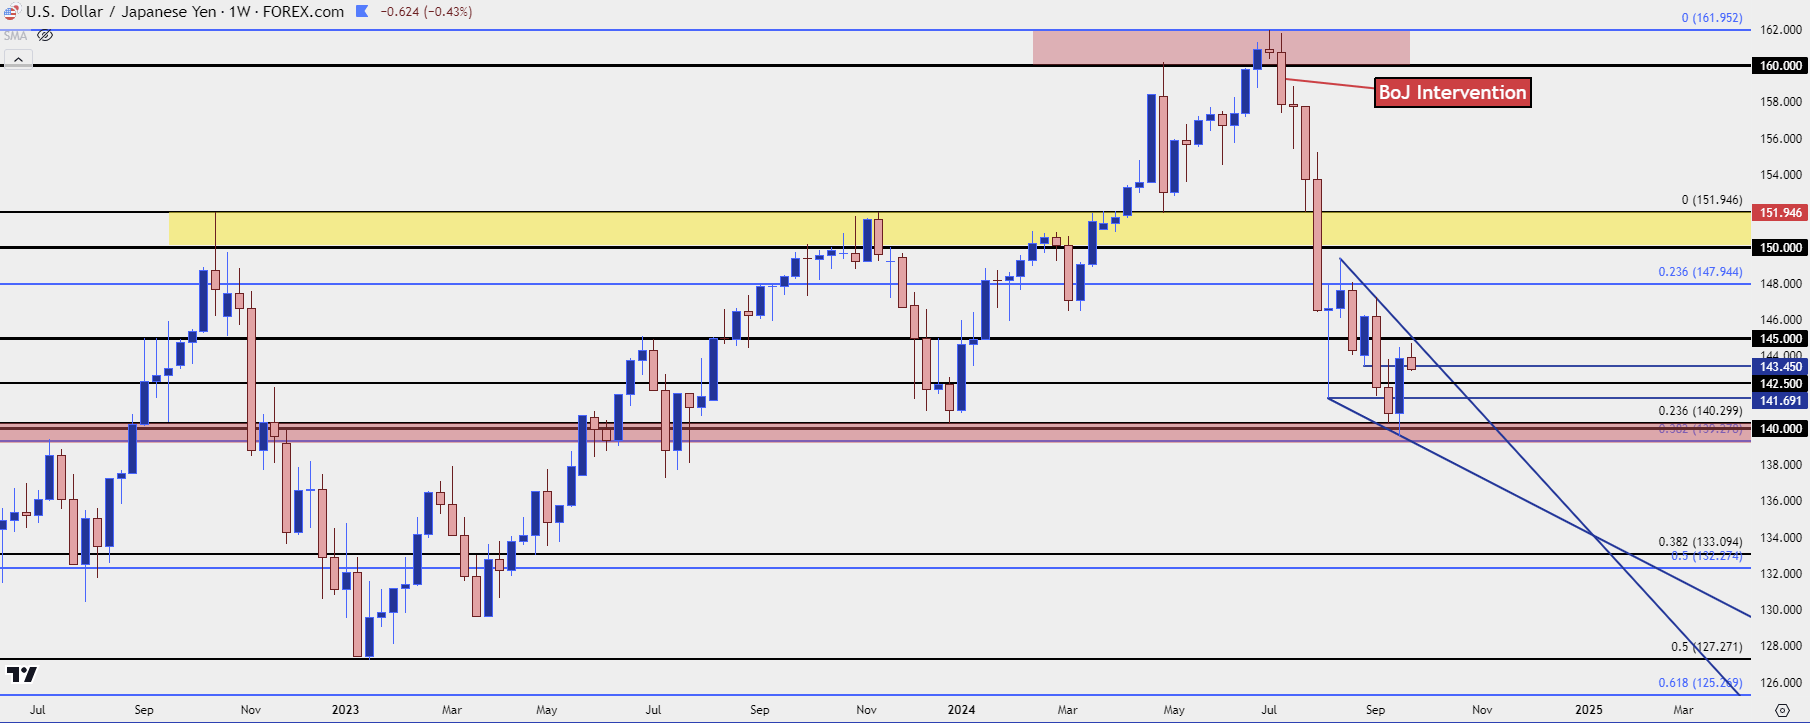 Chart prepared by James Stanley, USD/JPY on Tradingview
There was a spiraling effect that ran through the rest of July and into the August open. But as you can see from the above falling wedge, selling pressure slowed at 141.69 in August and then at the 140.00 test in September.
Such scenarios can be symptom of short-term oversold conditions and despite the fact that there’s a less bullish backdrop on the fundamental side – positioning matters. I’ve said quite a few times over the past month that fundamentals are not a direct driver of price; because what does push prices is supply and demand and while this can often be driven by fundamental nuance, that’s not always the case. And this is where divergences can show.
In USD/JPY that divergence can be seen as both figurative and literal. There’s been RSI divergence after that failed breakdown to open last week and there’s also been the bullish move showing in and around the FOMC rate decision even as the Fed took the more dovish route by cutting 50 bps.
At that rate decision USD/JPY perched down for a fresh low but it could not re-test the 140.30 Fibonacci level that had held the lows the previous Friday. That led-in to a rally of more than 400 pips into this morning’s high, all the way until the top side of the falling wedge was tested as resistance.
USD/JPY Daily Price Chart
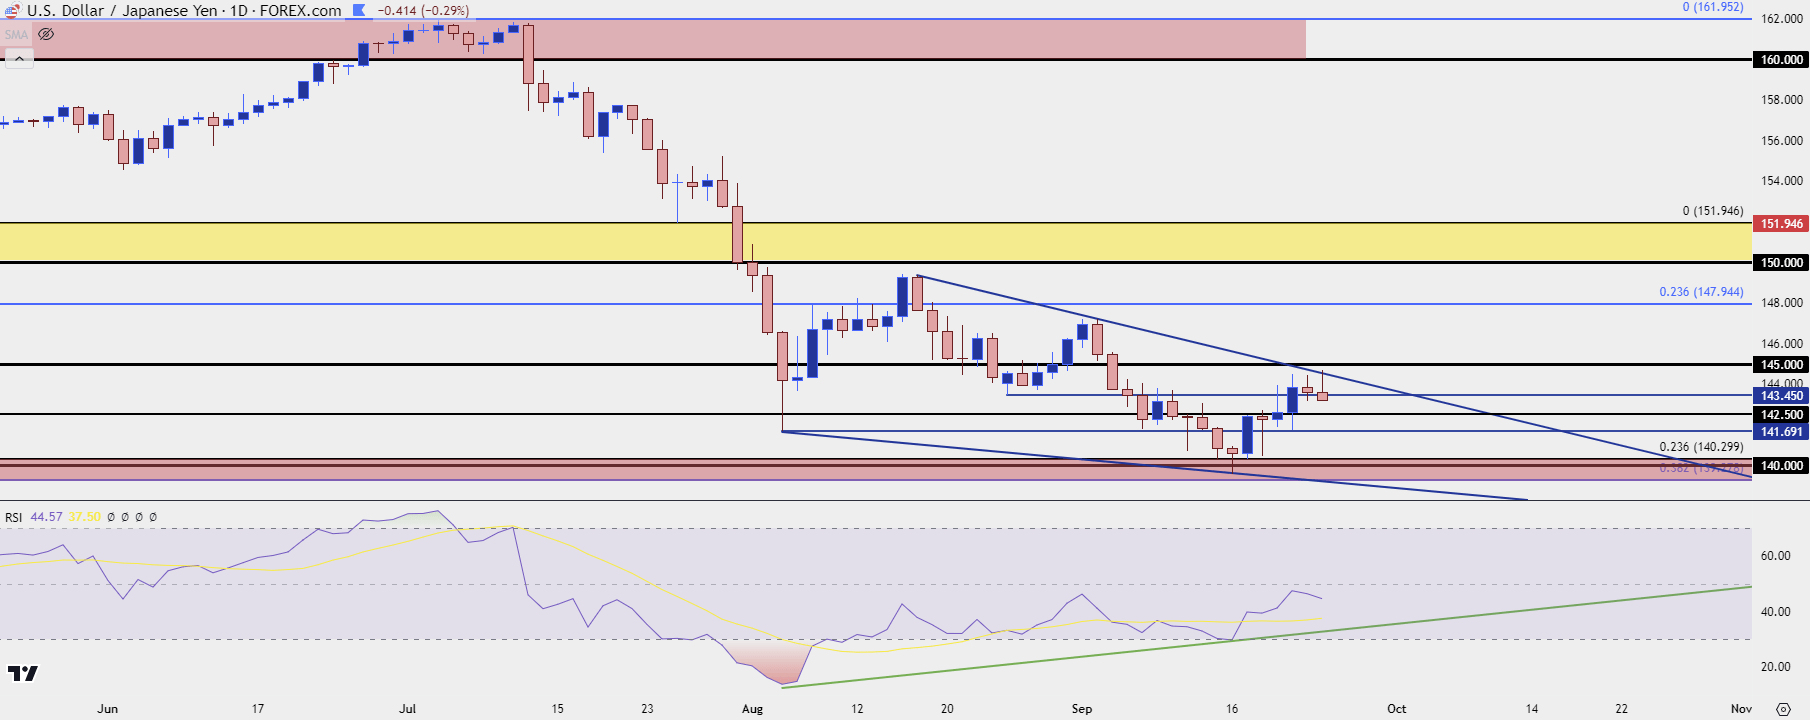 Chart prepared by James Stanley, USD/JPY on Tradingview
USD/JPY: Short-Cover Bounce v/s Return of Carry Unwind
Given the fact that we haven’t yet re-tested the 38.2% Fibonacci retracement of the 2021-2024 move, the trend that was largely driven by higher US inflation and, eventually, rate hikes from the FOMC, it’s logical to reason that there could be more room to go.
But – there’s also been an aggressive short-side trend that’s built in the case of RSI divergence looked at above. And sellers haven’t seemed so active upon tests of lows, leading to that lesser angle on the underside trendline.
So the big question here is whether longer-term longs are suddenly getting more motivated to close carry positions. Given the fact that price held inside of 145.00 overnight, with the bearish trendline in the wedge coming into play, that could be the case. Although it would be too early to say that with any degree of certainty.
The big test here will be whether shorter-term bulls show up to protect higher-lows in the week-long trend. There’s specific interest at the 142.50 psychological level, after which the 141.69 swing-low from early-August comes back into the picture. Notably, that latter level was defended on Friday so that remains a key spot of interest in shorter-term scenarios.
As I had discussed in the webinar earlier today, I’m expecting the USD to continue to drive on the basis of USD/JPY and that could have impact on other major pairs, such as EUR/USD or GBP/USD. If we do see a break of the 140.00 level in USD/JPY, that could lead to bullish breakouts in each of the above two pairs, along with AUD/USD and many other major FX markets.
USD/JPY Four-Hour Price Chart
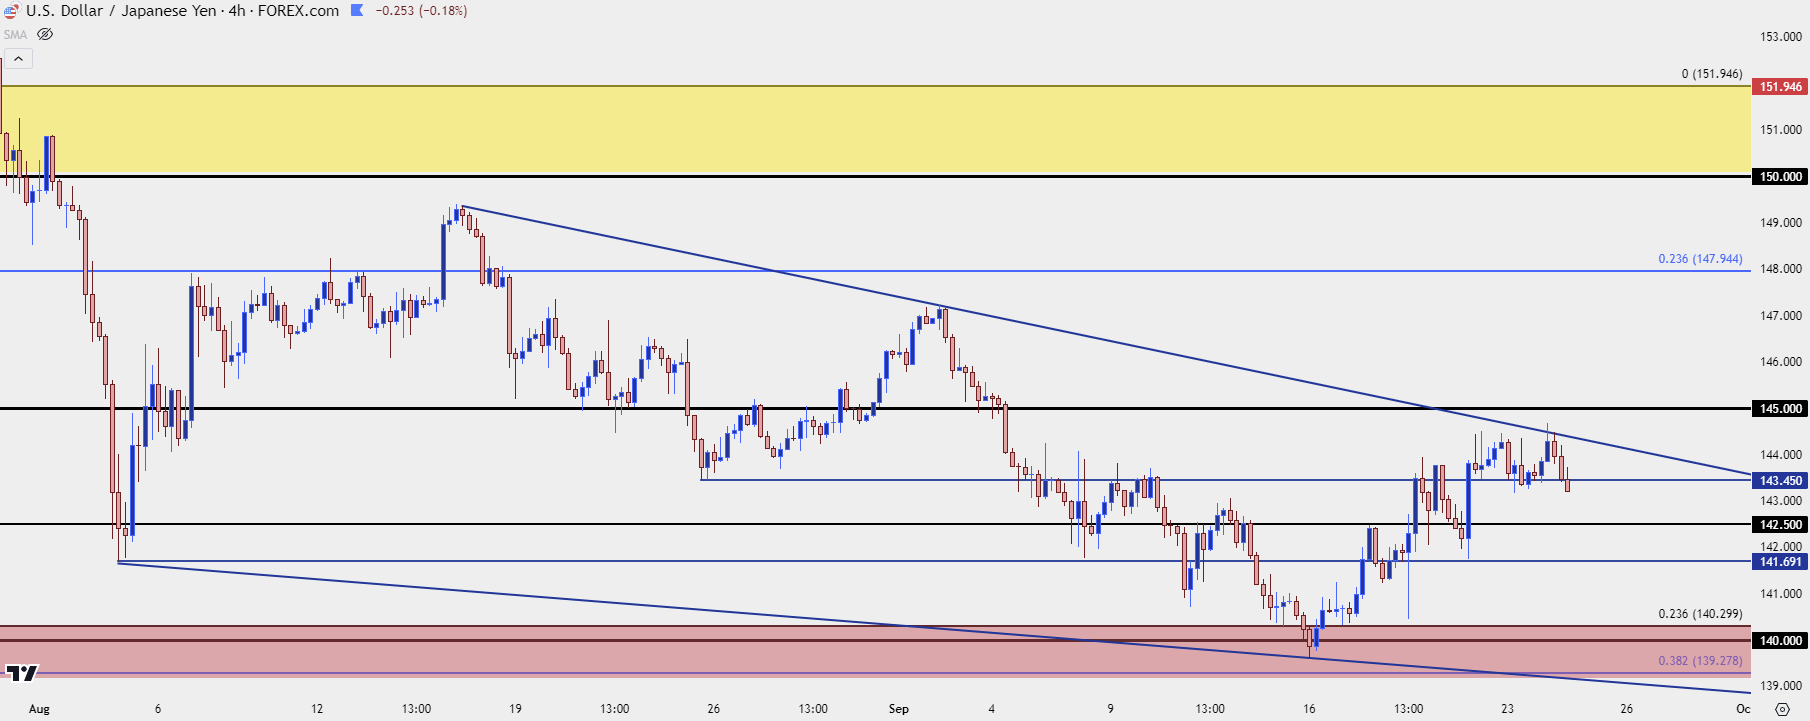 Chart prepared by James Stanley, USD/JPY on Tradingview
--- written by James Stanley, Senior Strategist
USD/JPY Talking Points:
- It’s been a strong past week for USD/JPY, even with a dimmer fundamental backdrop for the pair.
- USD/JPY tested below 140.00 for the first time in over a year to start last week, but that’s where sellers stalled and buyers took over. The pair set a higher-low after the FOMC rate decision and continued to push, all the way into today after which resistance showed at a descending trendline taken from mid-August and September swing highs
It’s been a busy year for USD/JPY and the final quarter of 2024 looks to be setting up for even more volatility.
Coming into the year one of the most ideal carry trade scenarios had held in the pair for the past few years. There was continued resistance at the 150-151.95 area but, given the November-December pullback last year, with support setting at the Fibonacci level of 140.30 in late-December, there was still scope for continuation.
The problem was that the Fed was highly expected to begin cutting rates in 2024 and the BoJ was potentially even moving towards a more-hawkish stance. That threatened to up-end the fundamental drive that had pushed USD/JPY from sub-103 at the 2021 open.
That 151.95 level was soon in-play in Q1 and it helped to hold the highs into the end of the quarter, even after the Bank of Japan began hiking rates in a very slight and careful manner. But it was April 10th that the pair broke out as an above-expected US CPI print brought on fears that the Fed may not be cutting soon. With that resistance so well-defined there were likely a lot of stops sitting just above. And stops on short positions are buy-to-cover logic, which adds demand into the market. Once that price was traded over a strong breakout took hold, and price continued to run until a test of the 160.00 handle.
At that point the BoJ stepped in to intervene, but the impact was limited. Price did drop for a little more than a week but support eventually showed at that same 151.95 level that had been defended before. And with US data looking strong and the Fed not yet ready to cut, price accelerated higher, pushing right back to 160 and this time, it didn’t stop. That breakout ran into early-July at which point the BoJ had to step in again.
It was July 11th when a below-expected US CPI report was released and with the help of intervention from the Bank of Japan, an aggressively bearish move showed up.
USD/JPY Weekly Chart
Chart prepared by James Stanley, USD/JPY on Tradingview
There was a spiraling effect that ran through the rest of July and into the August open. But as you can see from the above falling wedge, selling pressure slowed at 141.69 in August and then at the 140.00 test in September.
Such scenarios can be symptom of short-term oversold conditions and despite the fact that there’s a less bullish backdrop on the fundamental side – positioning matters. I’ve said quite a few times over the past month that fundamentals are not a direct driver of price; because what does push prices is supply and demand and while this can often be driven by fundamental nuance, that’s not always the case. And this is where divergences can show.
In USD/JPY that divergence can be seen as both figurative and literal. There’s been RSI divergence after that failed breakdown to open last week and there’s also been the bullish move showing in and around the FOMC rate decision even as the Fed took the more dovish route by cutting 50 bps.
At that rate decision USD/JPY perched down for a fresh low but it could not re-test the 140.30 Fibonacci level that had held the lows the previous Friday. That led-in to a rally of more than 400 pips into this morning’s high, all the way until the top side of the falling wedge was tested as resistance.
USD/JPY Daily Price Chart
Chart prepared by James Stanley, USD/JPY on Tradingview
USD/JPY: Short-Cover Bounce v/s Return of Carry Unwind
Given the fact that we haven’t yet re-tested the 38.2% Fibonacci retracement of the 2021-2024 move, the trend that was largely driven by higher US inflation and, eventually, rate hikes from the FOMC, it’s logical to reason that there could be more room to go.
But – there’s also been an aggressive short-side trend that’s built in the case of RSI divergence looked at above. And sellers haven’t seemed so active upon tests of lows, leading to that lesser angle on the underside trendline.
So the big question here is whether longer-term longs are suddenly getting more motivated to close carry positions. Given the fact that price held inside of 145.00 overnight, with the bearish trendline in the wedge coming into play, that could be the case. Although it would be too early to say that with any degree of certainty.
The big test here will be whether shorter-term bulls show up to protect higher-lows in the week-long trend. There’s specific interest at the 142.50 psychological level, after which the 141.69 swing-low from early-August comes back into the picture. Notably, that latter level was defended on Friday so that remains a key spot of interest in shorter-term scenarios.
As I had discussed in the webinar earlier today, I’m expecting the USD to continue to drive on the basis of USD/JPY and that could have impact on other major pairs, such as EUR/USD or GBP/USD. If we do see a break of the 140.00 level in USD/JPY, that could lead to bullish breakouts in each of the above two pairs, along with AUD/USD and many other major FX markets.
USD/JPY Four-Hour Price Chart
Chart prepared by James Stanley, USD/JPY on Tradingview
--- written by James Stanley, Senior Strategist
Related tags:
Latest market news




The complete CFD trading experience
Award-winning platforms, competitive spreads, low commissions and dedicated support.
We live and breathe the markets and are dedicated to helping traders realise their ambitions as we continue to set the industry bar.
Economic calendar
Web Trader platform
Our sophisticated web-based platform is packed with features.
Related articles
EUR/USD weekly outlook: FOMC and ECB to set the tone
The current backdrop is modestly bearish. On Friday, the EUR/USD closed modestly lower, down for the third consecutive day. The pair also posted a weekly decline after staging a modest recovery attempt in the previous week. Out of the past 8 weeks, the EUR/USD has fallen on 6 occasions. There is not much supporting factors for the single currency right now. So, the upside remains capped.

Gold Does Something it Hasn’t Done in a Year, is Larger Risk-Off Afoot?
With tech stocks getting hit harder last week there was collateral damage elsewhere, including gold as the metal closed below the $4k level for the week and that’s the first time that’s happened to spot gold in more than a year.

USD/JPY Weekly Outlook: AI earnings could overshadow the Fed and BoJ
AI sentiment has become a major driver of US Treasury yields and USD/JPY. With Microsoft, Alphabet and Amazon reporting this week, central bank decisions may have competition for traders' attention.
StoneX Europe Ltd may make third party material available on this website which may contain information included but not limited to the conditions of financial markets. The material is for information purposes only and does not contain, and should not be construed as containing, investment advice and/or investment recommendation and/or an investment research and/or an offer of or solicitation for any transactions in financial instruments; any decision to enter into a specific transaction shall be made by the client following an assessment by him/her of their situation.
StoneX Europe Ltd makes no representation or warranty and assumes no liability as to the accuracy or completeness of the information provided, nor any loss arising from any investment based on a recommendation, forecast or other information supplied. You should always seek independent advice as to your suitability to speculate in any related markets and your ability to assume the associated risks, if you are at all unsure. We are not under any obligation to update any such material. Any opinion made may be personal to the author and may not reflect the opinion of StoneX Europe Ltd.