





USD/JPY, USD/CAD implied volatility perks up, BOC and ISM up next
Today's BOC rate decision and an ISM report for the US places USD/CAD on volatility alert, alongside USD/JPY.
Share this:

The risk-off tone that kicked off the week continued to make waves on Tuesday, sending commodities and yields lower, although Wall Street indices remain reluctant to fully roll over. We are now approaching a binary data point from the US today via the ISM services report. Given the risk-off tone struck by Monday's manufacturing counterpart, we may get a more volatile reaction today, as services are arguably the more important read of the two due to their increased role in the economy.
The question is whether we will see an extension of the risk-off sentiment or a reversal of Monday's moves – provided ISM comes in hot enough to quash hopes of Fed cuts and deem the manufacturing print a false flag. Either way, it seems we are waiting for the US dollar to break out of the tight range between the 104 handle and the 200-day average. My guess is that we will see that today.
One-day implied volatility has perked up for USD/CAD, USD/CHF, and USD/JPY. The Swiss franc continues to weaken following the SNB's warning of currency intervention to ward off bears. It seems to be working. The Canadian dollar is likely to be caught in the crossfire of today's Bank of Canada (BOC) cash rate decision and the ISM services report, which occur within 15 minutes of each other.
There is well-grounded speculation that the BOC could hike rates. However, if they do, I doubt they will signal further hikes today. This could see CAD bears unwind, which could send USD/CAD sharply higher if ISM data comes in hot.
Economic events (GMT+1)
- 08:55 – German final PMIs
- 09:00 – Eurozone final PMIs
- 09:30 – UK final PMIs
- 10:00 – Eurozone PPI
- 13:15 – US ADP employment
- 12:45 – US final PMIs
- 12:45 – BOC cash rate decision, statement
- 15:00 – ISM services PMI
USD/JPY technical analysis:
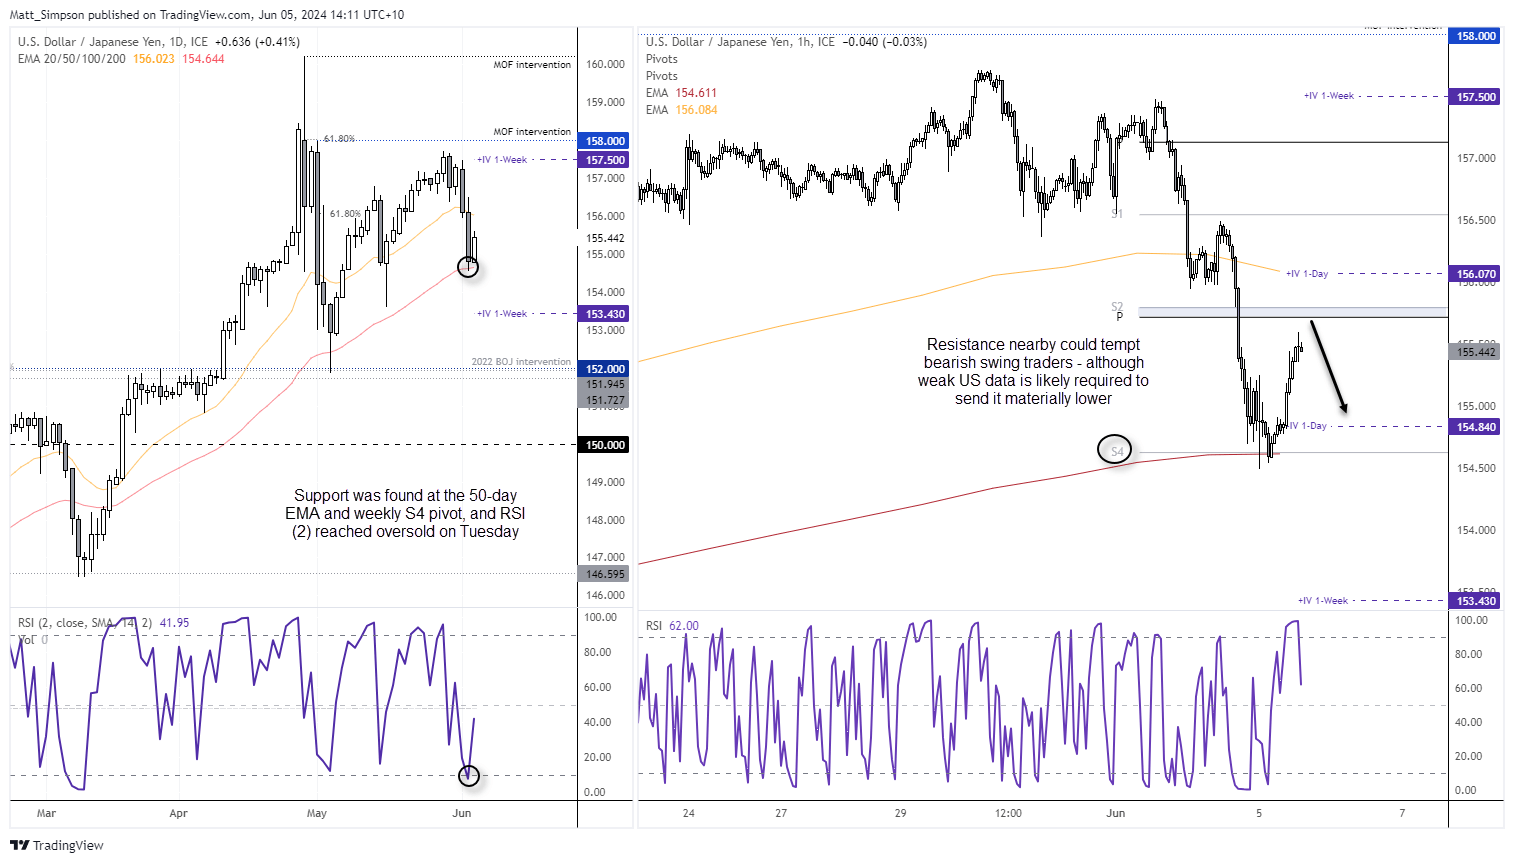
USD/JPY fell -1.6% over the past two days, which was its worst 2-day losses since May 2nd. Yet support was and hand to prompt a corrective bounce in today’s Asian session, including the 50-day EMA and weekly S4 pivot. The fact that it reached the S4 level just two days into the week itself shows how stretched the move was, with the daily RSI (2) reaching oversold being the icing on the cake.
The question now is where from here? And that is almost certainly down to how today’s IMS services report fares, with a strong headline figure alongside elevated ‘prices paid’ likely to support US yields and the USD, and send USD/JPY higher in the process. Yet if ISM services remains below 50 and prices paid softens, USD/JPY looks primed to drop.
The monthly pivot point and weekly S2 sit just beneath 155.80, and could become a pivotal level ahead of the report.
USD/CAD technical analysis:
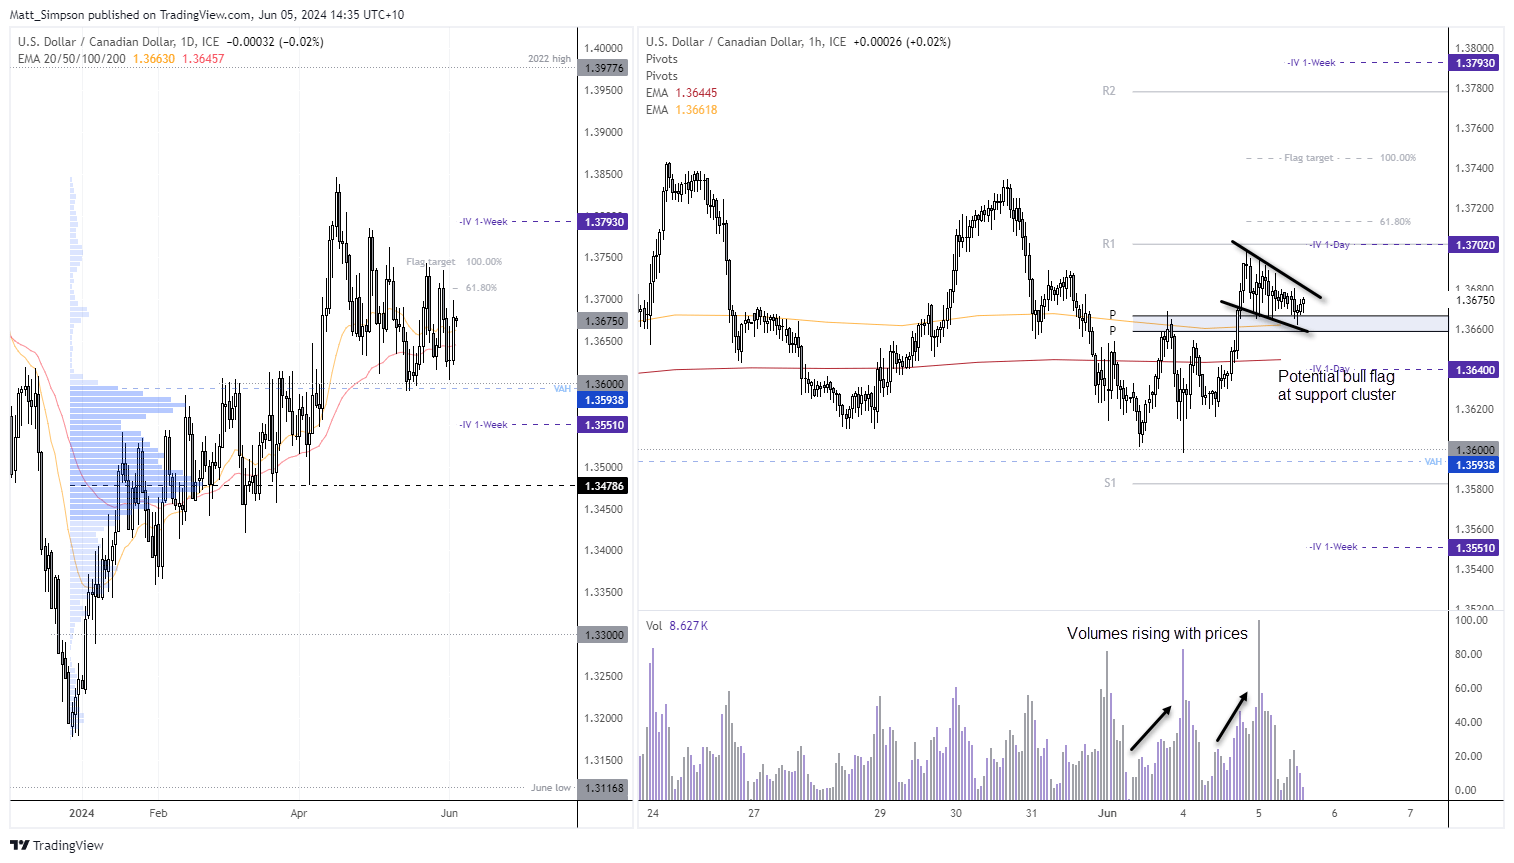
Price action on USD/CAD has been both frustrating but impressive at the same time. The daily chart shows lots of overlap which is sure to have frustrated position traders on this timeframe or above, it its direction is fickle at the best of times. Yet the pair has done a great job of holding above the 1.360 handle near the VAH (value area high) of the prior rally. And a ‘gun to head’ analysis favours USD/CAD to break above last week’s highs before it retests 1.36.
These choppy, overlapping daily candles have provided some clean moves on the 1-hour timeframe. We just best not expect such moves to last for more than a day or session at a time. A bull flag is forming just above the weekly and monthly pivot points and 20-day EMA, which suggests an upside break leading into the ISM report.
The 1-day implied volatility level seems quite narrow considering we have a BOC meeting on tap, and given it is within 15 minutes of the ISM report then volatility is expected. And I suspect we’ll see a larger move than the 1-day IV band implies.
View the full economic calendar
View the full economic calendar
-- Written by Matt Simpson
Follow Matt on Twitter @cLeverEdge
How to trade with City Index
You can trade with City Index by following these four easy steps:
- Open an account, or log in if you’re already a customer
• Open an account in the UK
• Open an account in Australia
• Open an account in Singapore
- Search for the market you want to trade in our award-winning platform
- Choose your position and size, and your stop and limit levels
- Place the trade
Related tags:


The complete CFD trading experience
Award-winning platforms, competitive spreads, low commissions and dedicated support.
We live and breathe the markets and are dedicated to helping traders realise their ambitions as we continue to set the industry bar.
Economic calendar
Web Trader platform
Our sophisticated web-based platform is packed with features.
Related articles

USD/CAD reversal risk builds as central bank showdown looms
USD/CAD has delivered a bullish reversal signal from established support, just as traders prepare for Fed and BoC decisions. Aggressive Canadian rate hike expectations and conflicting momentum signals make the coming session important.


EUR/USD weekly outlook: FOMC and ECB to set the tone
The current backdrop is modestly bearish. On Friday, the EUR/USD closed modestly lower, down for the third consecutive day. The pair also posted a weekly decline after staging a modest recovery attempt in the previous week. Out of the past 8 weeks, the EUR/USD has fallen on 6 occasions. There is not much supporting factors for the single currency right now. So, the upside remains capped.


USD/JPY Weekly Outlook: AI earnings could overshadow the Fed and BoJ
AI sentiment has become a major driver of US Treasury yields and USD/JPY. With Microsoft, Alphabet and Amazon reporting this week, central bank decisions may have competition for traders' attention.
StoneX Europe Ltd may make third party material available on this website which may contain information included but not limited to the conditions of financial markets. The material is for information purposes only and does not contain, and should not be construed as containing, investment advice and/or investment recommendation and/or an investment research and/or an offer of or solicitation for any transactions in financial instruments; any decision to enter into a specific transaction shall be made by the client following an assessment by him/her of their situation.
StoneX Europe Ltd makes no representation or warranty and assumes no liability as to the accuracy or completeness of the information provided, nor any loss arising from any investment based on a recommendation, forecast or other information supplied. You should always seek independent advice as to your suitability to speculate in any related markets and your ability to assume the associated risks, if you are at all unsure. We are not under any obligation to update any such material. Any opinion made may be personal to the author and may not reflect the opinion of StoneX Europe Ltd.