


Weekly COT report: Fastest pace of AUD short covering since March 2020
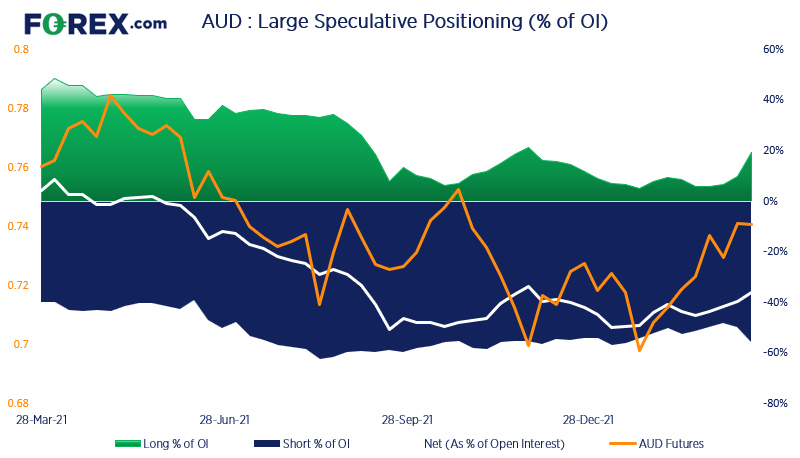
Last week, AUD shorts were culled at their fastest pace since March 2020, when eye watering levels of stimulus was rolled out at their height of the pandemic.
Share this:
As of Tuesday 15th March 2022:
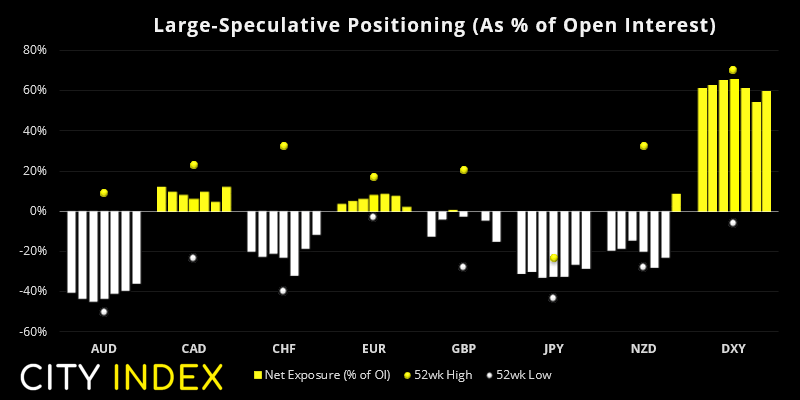
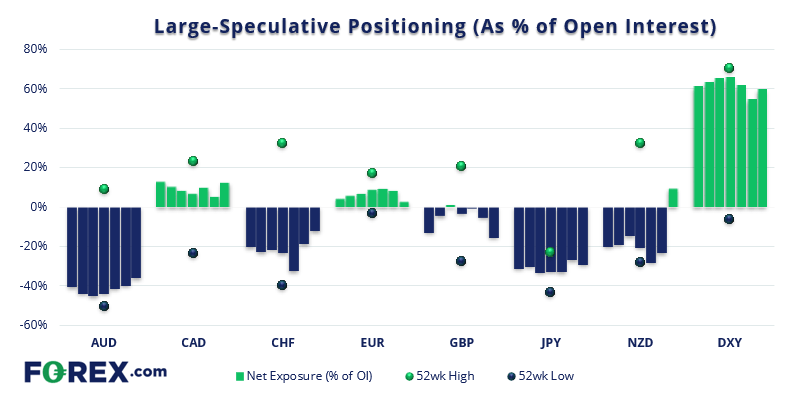
- The Australian dollar and euro futures contracts saw the largest weekly repositioning, with AUD net-short exposure falling by -33.3k contracts and EUR net-longs falling by -40.1 contracts.
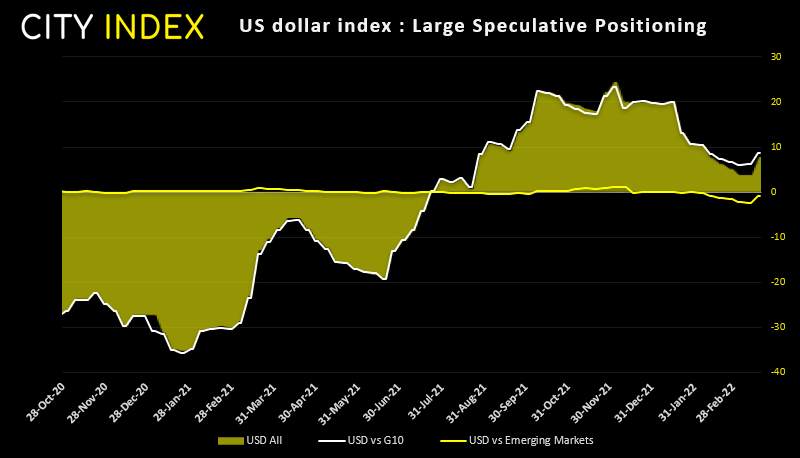
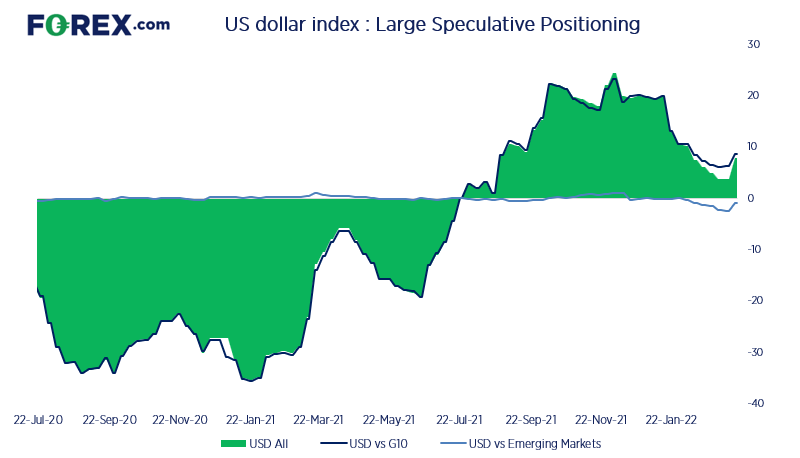
- Net-long exposure to the US dollar index fell to its least bullish level in 24-weeks.
- Interestingly, net-long exposure to euro futures also fell, to their least bullish level in 9-weeks.
- Net-short exposure to CHF futures fell to their least bearish level since September.
- Traders remained net-long Russian rubles by 7.5k contracts (down from 19.5k end of February) but open interest is its lowest since December 2020.
- Traders were their most bearish on GBP futures in 11-weeks.
Read our guide on how to interpret the weekly COT report
Read our guide on how to interpret the weekly COT report
AUD futures:
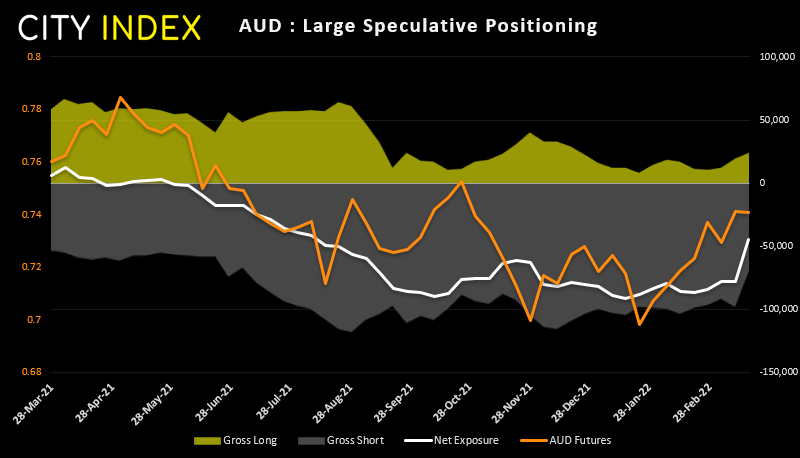
The Aussie saw a sharp reduction in net-short exposure last week, which fell -33.4k contracts – its sharpest move since March 2015. 28.6k short contracts were culled, which was its most aggressive rate of short-covering since March 2020 and 4.8k long contracts were added. A strong commodities rally driven by geopolitics and supply concerns, alongside a hawkish Fed and less dovish RBA) is finally seeing those tired shorts run for cover and helped push AUD bac above 74c. Should we see more hawkish rhetoric from RBA then (dare we say) we could even see AUD back above 80c.
NZD futures:
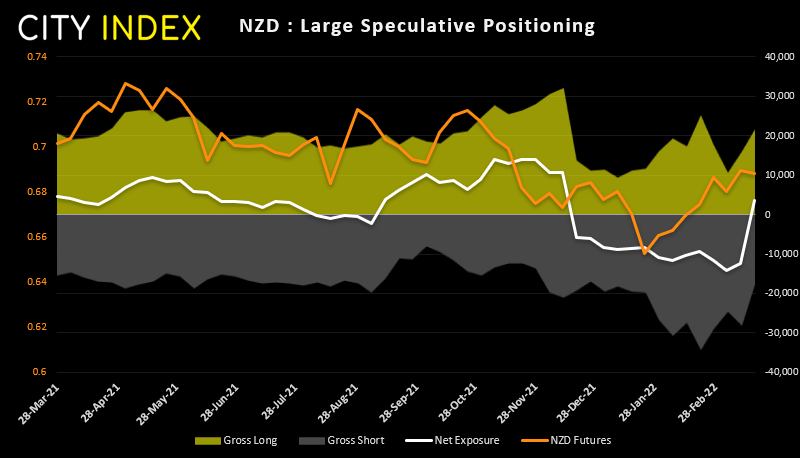
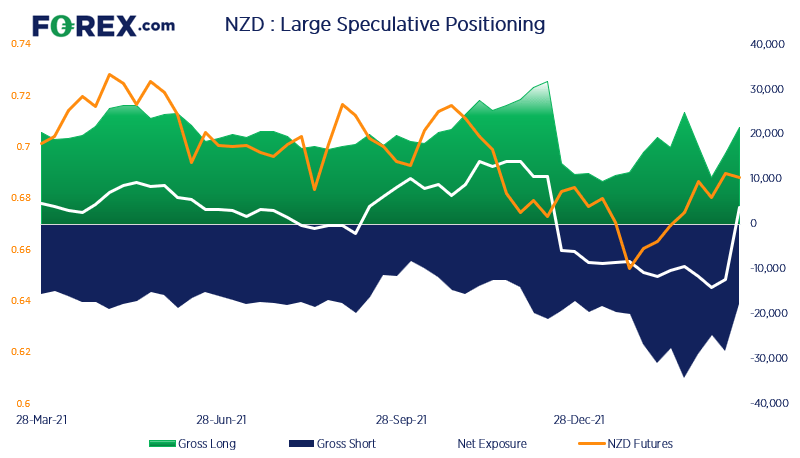
Traders flipped to net-long exposure to NZD futures for the first time in 3-months. And like AUD, we saw a strong reduction of gross shorts (-10.3k contracts) and increase of longs (5.7k contracts). Money markets have fully priced in a further 3 hikes over the next six months with the 6-month OIS rising to 1.75%. And the surge in commodities pricing with global inflation on the rise doing little to dispel expectations of further hikes which remain supportive of NZD.
USD exposure:
Traders were net-long the USD by US $8.7 billion according to IMM (International Money Market, $709 billion of which was against G10 currencies. We saw a sharp drop on exposure to emerging FX, with USD exposure rising by $1.6 billion last week alone, which is its fastest rise since March 2020.
How to trade with City Index
You can easily trade with City Index by using these four easy steps:
- Open an account, or log in if you’re already a customer
• Open an account in the UK
• Open an account in Australia
• Open an account in Singapore
- Search for the company you want to trade in our award-winning platform
- Choose your position and size, and your stop and limit levels
- Place the trade
Latest market news




The complete CFD trading experience
Award-winning platforms, competitive spreads, low commissions and dedicated support.
We live and breathe the markets and are dedicated to helping traders realise their ambitions as we continue to set the industry bar.
Economic calendar
Web Trader platform
Our sophisticated web-based platform is packed with features.
Related articles
Extreme Euro Shorts Meet Renewed US Dollar Strength | COT Report
Euro net-shorts hit an 11-year extreme as the US dollar rebounds. COT positioning reveals growing pressure on sterling and commodity currencies.
EUR/USD Forecast: Euro Under Pressure After Strong NFP Data
As the trading week comes to an end, the euro has once again struggled to sustain a meaningful recovery against the U.S. dollar, highlighting renewed weakness within EUR/USD price action. During the final trading session of the week, the pair declined nearly 0.7%, reflecting that confidence around the European currency remains limited in the short term.

Australian Dollar Short-term Outlook: AUD/USD 3% Plunge Puts Multi-Month Range at Risk 11 6 2026
A sharp equity-led selloff has driven AUD/USD toward critical June-low support, with strong NFP data adding pressure ahead of next week’s U.S. CPI.

StoneX Europe Ltd may make third party material available on this website which may contain information included but not limited to the conditions of financial markets. The material is for information purposes only and does not contain, and should not be construed as containing, investment advice and/or investment recommendation and/or an investment research and/or an offer of or solicitation for any transactions in financial instruments; any decision to enter into a specific transaction shall be made by the client following an assessment by him/her of their situation.
StoneX Europe Ltd makes no representation or warranty and assumes no liability as to the accuracy or completeness of the information provided, nor any loss arising from any investment based on a recommendation, forecast or other information supplied. You should always seek independent advice as to your suitability to speculate in any related markets and your ability to assume the associated risks, if you are at all unsure. We are not under any obligation to update any such material. Any opinion made may be personal to the author and may not reflect the opinion of StoneX Europe Ltd.