



WTI Crude Oil & Gold Price Forecast: Head and Shoulders Breakdown Risk?
As markets price in a potential US-Iran deal amid rising Middle East tensions, WTI crude oil price action is forming a head and shoulders reversal pattern. Meanwhile, gold and silver prices remain capped below 5200 and 90 resistance. Is a commodity breakout coming, or does a breakdown risk dominate?
Share this:

Key Events
- Gold and silver prices are struggling to clear key resistance levels at 5200 and 90, as crude continues to cap below 67, reflecting expectations of a possible US-Iran deal
- Upside risk potential remains should tensions escalate, keeping key levels in focus to confirm structural shifts within these steep trends
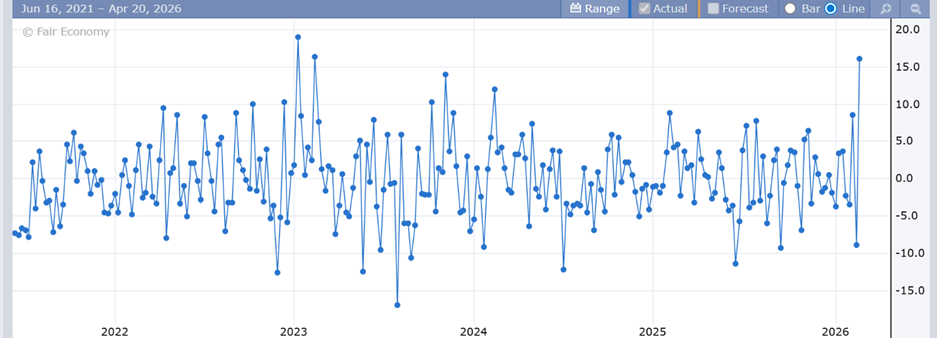
- Crude oil inventories climbed by 16 million barrels, reaching 2-year highs, and adding further pressure on prices
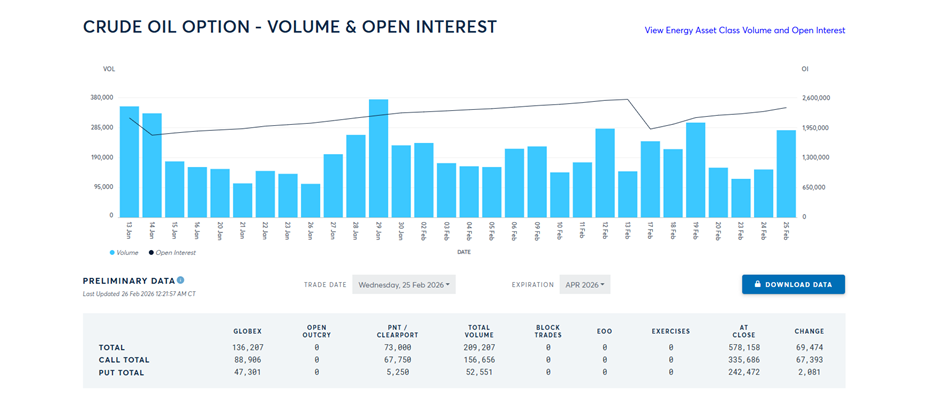
- Crude oil call options rose significantly, reviving contrarian interest in line with crude’s dominant downtrend since 2022
CME Crude Oil Options Data
Source: CME
CME crude oil options data reflects aggressive call positioning, with a 67,393 contract increase, bringing total call volume to 156,656, while put changes rose by only 2,081, keeping total puts near 52,551. This setup logically supports aggressive bullish positioning and could reinforce price action should the trend above 67 continue. However, given recent consolidation and emerging reversal concerns, this surge may also be interpreted from a contrarian perspective.
Crude Oil Inventories
Source: Forex Factory
Another factor weighing on crude prices is the recent 16 million barrel surge in inventories. This level was last seen in February 2023, increasing supply-side pressure as the winter season eases. If Middle East geopolitical tensions settle, downside risks may remain elevated.
Technical Analysis: Quantifying Uncertainties
Crude Oil Outlook: 4-Hour Time Frame – Log Scale
Source: Trading view
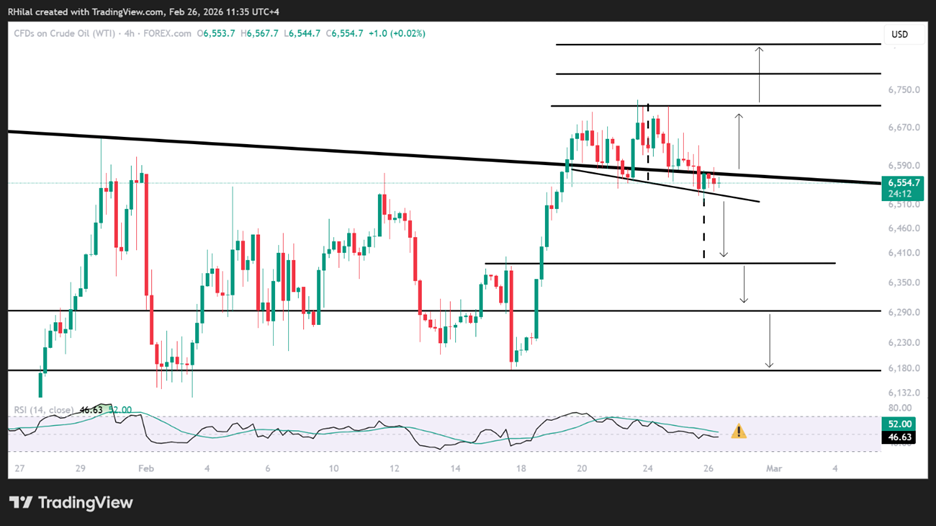
From a 4-hour perspective, crude prices continue consolidating above the upper bound of the 2.5-year downtrending channel, clearly illustrated in the weekly chart below. From this angle, a potential head and shoulders reversal pattern is forming, holding above the 65.20 support level.
H&S, Bearish Scenario:
A breakdown below 65.20 exposes the 63.90 target, aligning with the 0.618 Fibonacci retracement of the February 17 (61.70) to February 23 (67.30) upswing, creating a potential short-term dip-buying zone.
A deeper break extends drawdown risks toward 62.90 and 61.70. This zone may either support a neutral bullish hold or reassert bearish bias toward the lower 50s, easing inflationary concerns in future rate projections.
Bullish Continuation Scenario:
On the upside, a sustained move above 66.60 and 67.20 reopens upside risk toward the June 2025 highs reached during the previous Iran-Israel conflict, targeting 70, 74, and 78 respectively.
Crude Oil Outlook: Weekly Time Frame – Log Scale
Source: Trading view
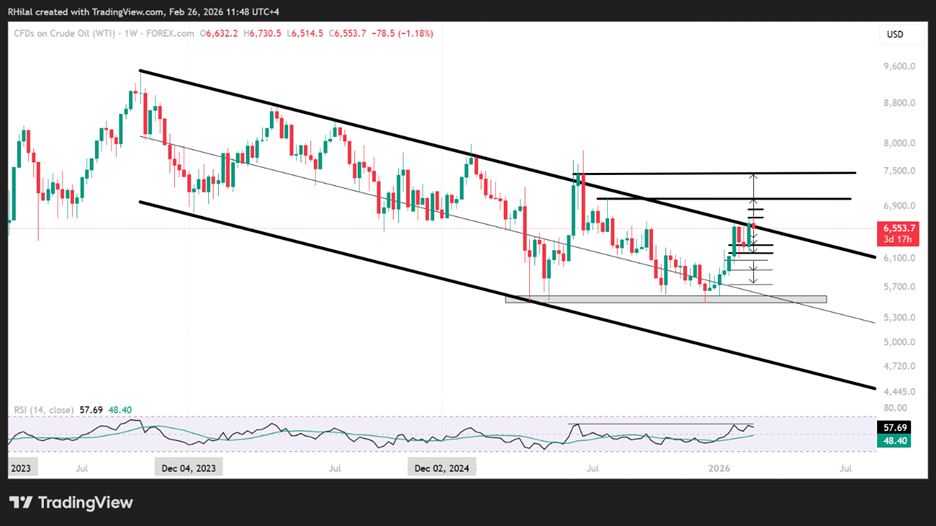
From a weekly perspective, the respected downtrend from the September 2023 highs shows price attempting a bullish breakout, potentially mimicking the June 2025 setup that ultimately proved unsustainable after closing back inside the channel.
Given the steep rise in call option positioning, a pullback inside the channel remains possible from a contrarian view. On the upside, a weekly close above the channel bounds and above 78 would extend long-term structural upside expectations, reintroducing inflation pressures.
How does this translate to gold?
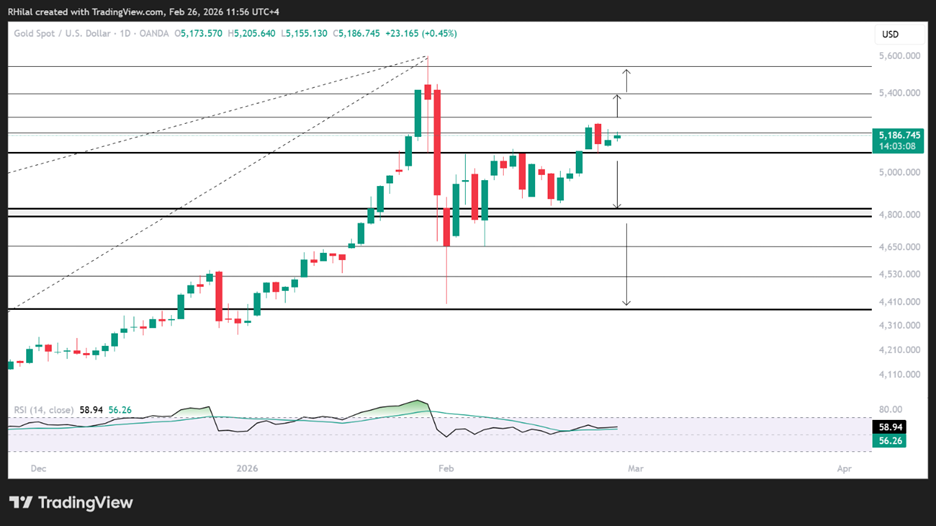
Gold and silver are attempting to break above resistance levels at 5200 and 90 but have failed to sustain gains so far this week, raising drawdown risks should a near-term geopolitical deal materialize. In correlation with crude, a breakdown in oil could align with weakness in gold and silver. Key bearish levels stand at 5100 for gold and 85 for silver.

Gold Outlook: Daily Time Frame – Log Scale
Source: Trading view
On the daily chart, RSI momentum maintains a bullish tilt above the neutral 50 level and its moving average. However, recent price action, particularly the February 24 candle, reflects bearish dominance and indecision, with multiple rejections from the 5200 zone.
A breakdown below 5100 exposes 4800 once again, followed by 4600, 4530, and 4380. On the upside, holding above 5300 realigns gains toward 5400 and 5600, with 6100 emerging as the next threshold should prices close above those highs.
In this environment, defense and disciplined long-term levels matter more than shifting narratives.
Written by Razan Hilal, CMT
Follow on X: @Rh_waves
Related tags:



The complete CFD trading experience
Award-winning platforms, competitive spreads, low commissions and dedicated support.
We live and breathe the markets and are dedicated to helping traders realise their ambitions as we continue to set the industry bar.
Economic calendar
Web Trader platform
Our sophisticated web-based platform is packed with features.
Related articles
USD/JPY weekly outlook: Quarter turn scrambles rates regime
USD/JPY’s tight relationship with front-end US rates broke down sharply last week, but quarter-turn flows and positioning suggest the disconnect may prove temporary.

Gold Update: XAU/USD Remains Under Pressure Even After the NFP Report
As the trading week comes to an end, weakness around gold price action remains evident in the short term. This can be seen in the performance of the past two sessions, where the metal has declined by approximately 0.3%. Although the move has not been particularly aggressive, it highlights that buying pressure continues to struggle to regain control of the market.


Dow Jones Forecast: DJIA rises after weaker jobs data
U.S. stocks are rising after weaker-than-expected U.S. jobs data saw markets rein in rate hike expectations.

StoneX Europe Ltd may make third party material available on this website which may contain information included but not limited to the conditions of financial markets. The material is for information purposes only and does not contain, and should not be construed as containing, investment advice and/or investment recommendation and/or an investment research and/or an offer of or solicitation for any transactions in financial instruments; any decision to enter into a specific transaction shall be made by the client following an assessment by him/her of their situation.
StoneX Europe Ltd makes no representation or warranty and assumes no liability as to the accuracy or completeness of the information provided, nor any loss arising from any investment based on a recommendation, forecast or other information supplied. You should always seek independent advice as to your suitability to speculate in any related markets and your ability to assume the associated risks, if you are at all unsure. We are not under any obligation to update any such material. Any opinion made may be personal to the author and may not reflect the opinion of StoneX Europe Ltd.