



ASX 200 Outlook: CSL, COH, Drag Healthcare and ASX Lower
Healthcare stocks slump as Cochlear plunges, dragging the ASX 200 lower despite easing geopolitical tensions.
Share this:

The ASX 200 has slipped into a more defensive tone, with healthcare stocks driving a sharp selloff despite an extension to the Iran ceasefire. A steep decline in Cochlear (COH) weighed heavily on the broader index, raising questions about whether the market is entering a deeper pullback or simply pausing before its next move higher.
View related analysis:
View related analysis:
ASX 200 Outlook: CSL, COH Drag Healthcare and ASX Lower
ASX 200 Market Snapshot
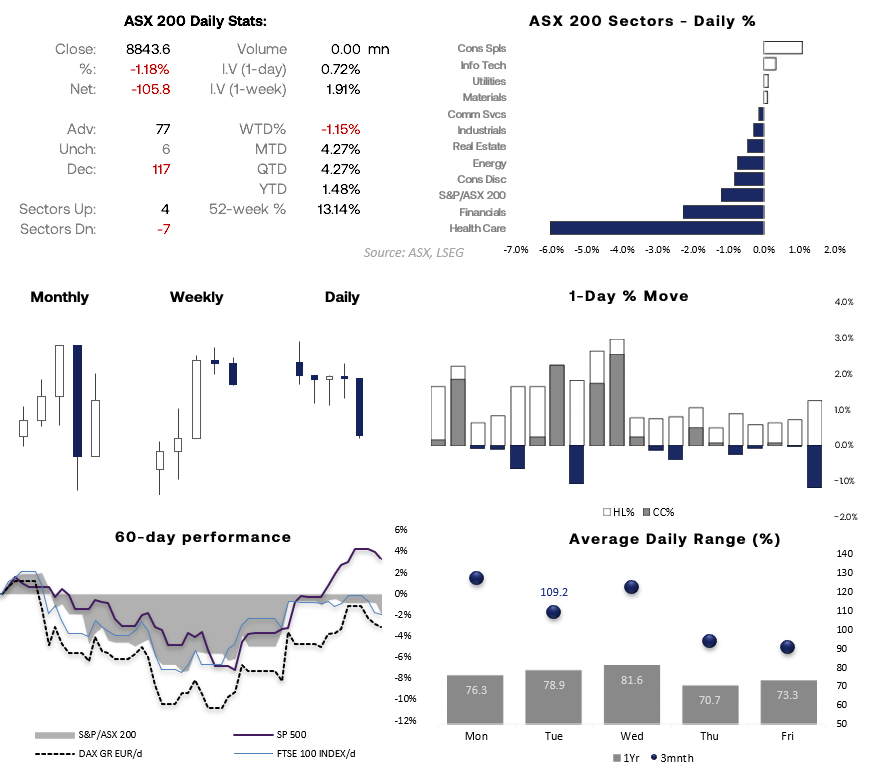
- The ASX 200 fell -1.2% on Wednesday, despite the US announcing an indefinite extension to the Iran ceasefire
- The day’s range of 1.25% marked its most volatile session in two weeks, pushing the index into a clearer corrective phase
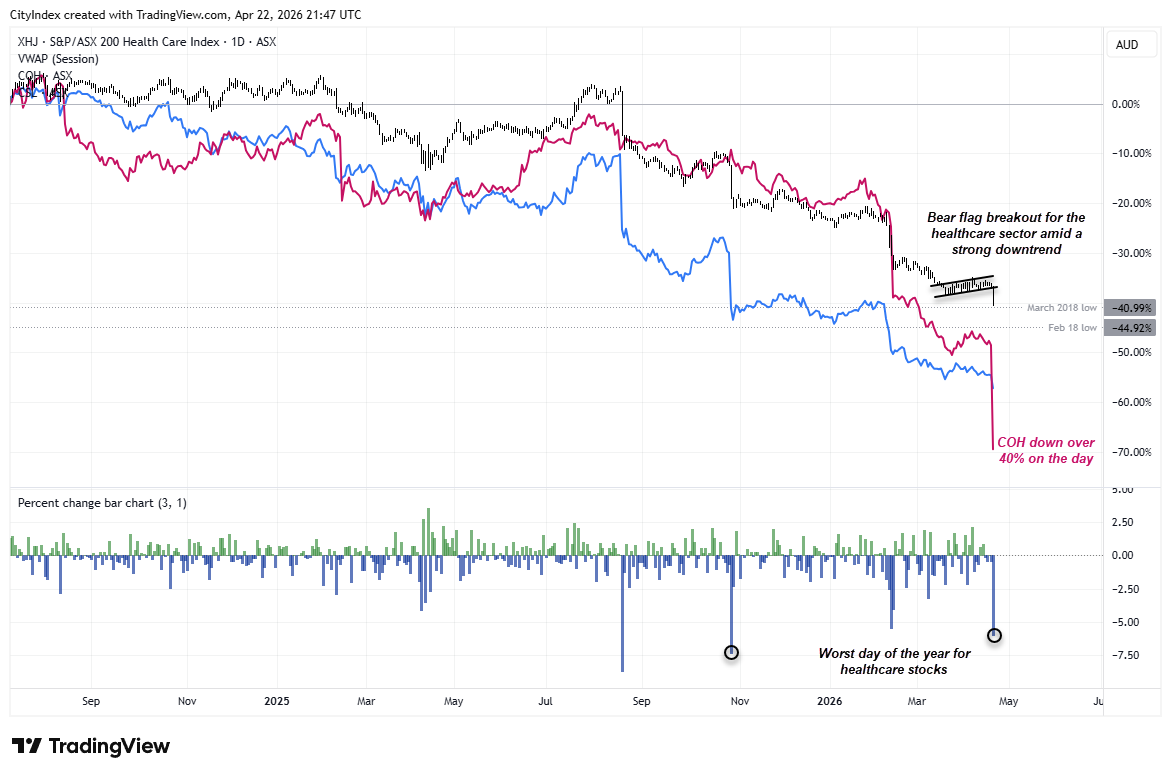
- Healthcare (XHJ) led seven sectors lower, falling -6% in its worst session since October. Cochlear (COH) plunged -40.7%, Global Health (GLH) fell -12.8%, and CSL (CSL) declined -5.7%
- Financials (XFJ) also fell -2.2%, with CBA (CBA) down -2.5%, leading the Big Four lower
- Consumer staples (XSJ) rallied for a third consecutive session, closing at their highest level since August 2023, with Woolworths (WOW) and Coles (COL) rising 0.9% and 0.4% respectively
- Volatility typically eases into the end of the week, based on 3-month and 1-year averages
Source: ASX, LSEG


Healthcare Sector Breaks Down as Selling Accelerates
The ASX healthcare sector (XHJ) has taken a decisive turn lower, breaking down from a bear flag pattern within an established downtrend — a classic continuation signal. The move has been led by Cochlear (COH), which plunged more than 40% in a single session, dragging the broader sector sharply lower. Relative performance has also deteriorated against the wider market, highlighting clear capital rotation away from healthcare.
Ultimately, this looks like a bearish trend breakdown, and rallies in names such as CSL (CSL) and Ramsay Health Care (RHC) may continue to be sold unless the sector can reclaim key support levels.
Source: ASX, LSEG
ASX 200 Technical Analysis
ASX 200 Range Holds as 9000 Caps Upside and 8900 Acts as Key Pivot
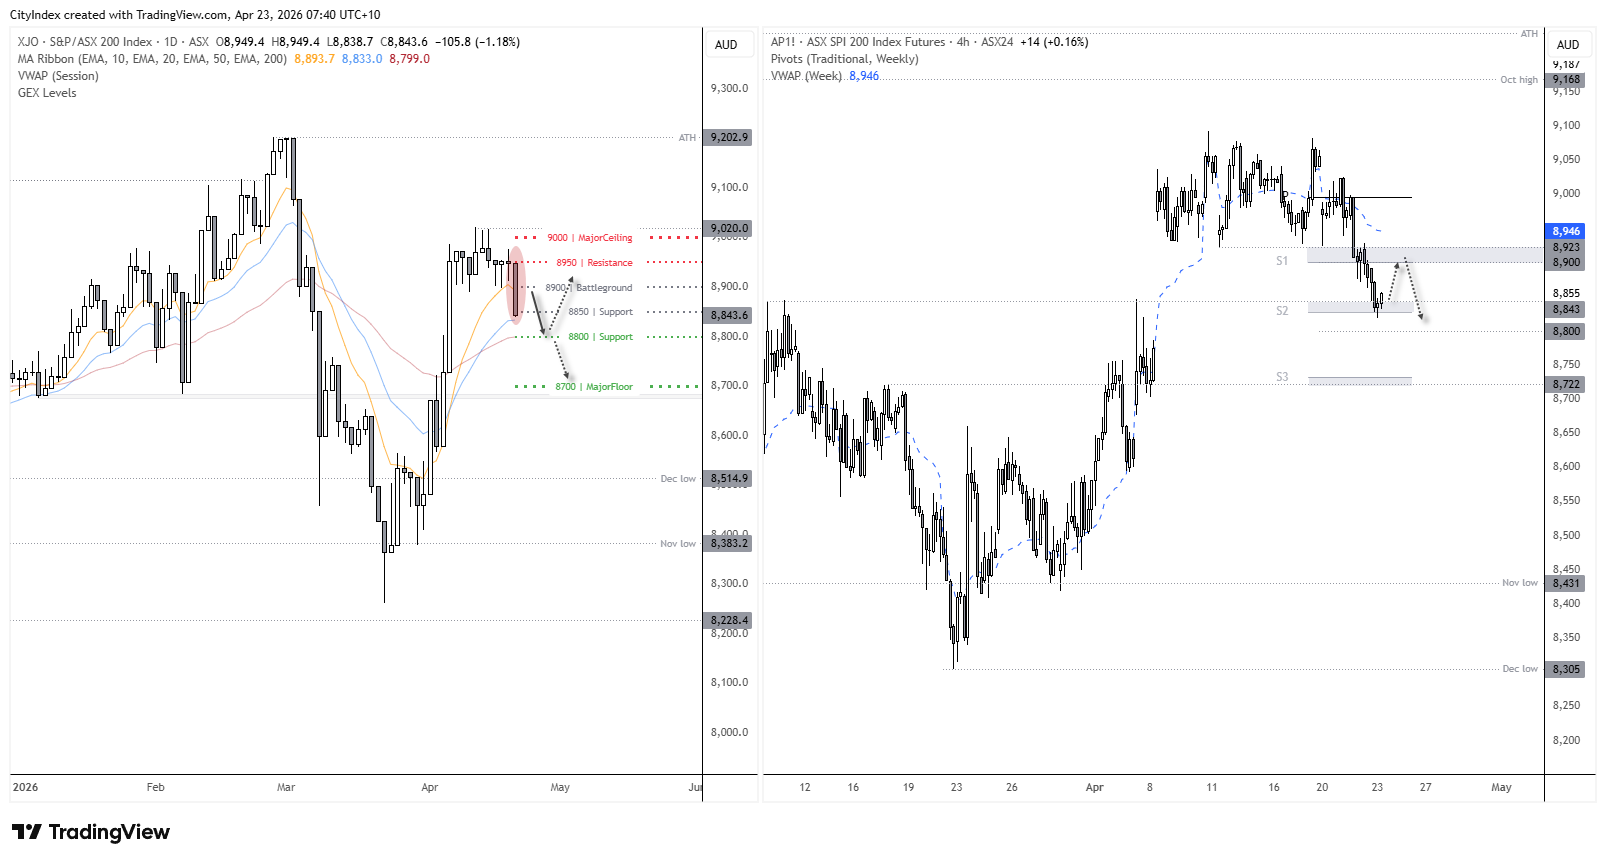
Options positioning shows the ASX 200 remains within a defined trading range, with key levels clustering around current price. The 8900 area is the main battleground, where price may continue to consolidate. Above, 8950–9000 forms a resistance zone, where rallies are likely to slow. On the downside, 8800 provides initial support, with 8700 acting as a stronger floor if selling pressure builds.
In a nutshell: Expect range-bound conditions, with chop around 8900, resistance near 9000, and support layered below 8800.
Momentum Turns Lower as 8900 Resistance Caps Near-Term Upside
The daily chart shows momentum has turned against the prior rally, following a tight consolidation near cycle highs. The 50-day EMA sits around 8800, making it a viable near-term downside target for bears.
However, SPI 200 (ASX 200) futures attempted to build support above the March 11 high and weekly S2 pivot point overnight, leaving scope for a near-term bounce. That said, resistance around weekly S1 pivot and 8900–8923 zone may attract sellers, particularly as it sits well below the weekly VWAP, which is now curling lower.
Source: ASX, TradingView
View the full economic calendar
View the full economic calendar
-- Written by Matt Simpson
Follow Matt on Twitter @cLeverEdge
How to trade with City Index
You can trade with City Index by following these four easy steps:
- Open an account, or log in if you’re already a customer
• Open an account in the UK
• Open an account in Australia
• Open an account in Singapore
- Search for the market you want to trade in our award-winning platform
- Choose your position and size, and your stop and limit levels
- Place the trade
Related tags:
Latest market news




Open an account in minutes
Experience award-winning platforms with fast and secure execution, and enjoy tight spreads from 0.5 pts on FX and 0.3 pts on indices.
Economic calendar
Web Trader platform
Our sophisticated web-based platform is packed with features.
Related articles
S&P 500, Nasdaq 100 Claw Back But NVDA Cloud Looms Overhead
Last week was green for both the Nasdaq and S&P 500 but given the sell-off that led into that bounce there’s still a very real question as to whether bears still have a statement to make. And the NVDA situation presents a very real threat.
US dollar forecast: USD/JPY and USD/CHF in focus | Forex Friday
Sticky US inflation and a hawkish Fed have kept the dollar firm across the majors, with USD/JPY pressing on the 160 handle. Here are the levels that matter on USD/JPY and USD/CHF as next week's retail sales, Nvidia results and FOMC minutes approach.


Gold outlook: seasonal tailwind offers hope with XAU/USD below $4,000
A historically stronger seasonal window and steady central bank buying are offering gold some hope after its slide to a fresh 2026 low. Reclaiming the 4,000 mark is the first sign that the metal may have found a floor.
This report is intended for general circulation only. It should not be construed as a recommendation, or an offer (or solicitation of an offer) to buy or sell any financial products. The information provided does not take into account your specific investment objectives, financial situation or particular needs. Before you act on any recommendation that may be contained in this report, independent advice ought to be sought from a financial adviser regarding the suitability of the investment product, taking into account your specific investment objectives, financial situation or particular needs.
StoneX Financial Pte. Ltd., may distribute reports produced by its respective foreign entities or affiliates within the StoneX group of companies or third parties pursuant to an arrangement under Regulation 32C of the Financial Advisers Regulations. Where the report is distributed to a person in Singapore who is not an accredited investor, expert investor or an institutional investor (as defined in the Securities Futures Act), StoneX Financial Pte. Ltd. accepts legal responsibility to such persons for the contents of the report only to the extent required by law. Singapore recipients should contact StoneX Financial Pte. Ltd. at 6826 9988 for matters arising from, or in connection with the report.
In the case of all other recipients of this report, to the extent permitted by applicable laws and regulations neither StoneX Financial Pte. Ltd. nor its associated companies will be responsible or liable for any loss or damage incurred arising out of, or in connection with, any use of the information contained in this report and all such liability is hereby expressly disclaimed. No representation or warranty is made, express or implied, that the content of this report is complete or accurate.
StoneX Financial Pte. Ltd. is not under any obligation to update this report.
Trading CFDs carries a high level of risk that may not be suitable for some investors. Consider your investment objectives, level of experience, financial resources, risk appetite and other relevant circumstances carefully. The possibility exists that you could lose some or all of your investments, including your initial deposits. If in doubt, please seek independent expert advice. Visit www.forex.com/en-sg/terms-and-policies for the complete Risk Disclosure Statement.