



AUD/USD Outlook: Pullback Below 0.72 Underway as Geopolitical Risks Intensify
AUD/USD pulls back below 0.72 as Middle East tensions rise. Volatility looks underpriced, with key support levels now coming into focus.
Share this:

AUD/USD has pulled back from multi-year highs after briefly tagging 0.72, as renewed Middle East tensions weigh on risk sentiment. While the broader uptrend remains intact, price action suggests a corrective phase is underway, with key support levels now coming into focus.
Despite the pullback, implied volatility has dropped sharply from recent highs, raising questions over whether markets are underpricing near-term risk. With a light economic calendar ahead, geopolitics is likely to remain the dominant driver for AUD/USD in the sessions to come.
View related analysis:
- US Dollar Index Outlook: Bullish Bounce Overshadowed by Major Top Risk
- ASX 200 Outlook: Tech Stocks Surge as Traders Eye Dips
- Gold Outlook: Rally Slows Near $5000 as Bearish Signals Build
- Japanese Yen Price Action Setups: USD/JPY, AUD/JPY, CHF/JPY
- Australian Dollar Outlook: AUD/USD Steady Despite Geopolitical Uncertainty
View related analysis:
- US Dollar Index Outlook: Bullish Bounce Overshadowed by Major Top Risk
- ASX 200 Outlook: Tech Stocks Surge as Traders Eye Dips
- Gold Outlook: Rally Slows Near $5000 as Bearish Signals Build
- Japanese Yen Price Action Setups: USD/JPY, AUD/JPY, CHF/JPY
- Australian Dollar Outlook: AUD/USD Steady Despite Geopolitical Uncertainty
AUD/USD Pullback Below 0.72 as Geopolitical Risks Drive Market Sentiment
- AUD/USD printed its highest weekly close in nearly four years, although Friday’s shooting star warns of potential weakness within the broader rally
- AUD/CAD rose for a third week but formed a wide-legged doji around 0.98, signalling hesitation near its five-year high
- AUD/CHF also advanced for a third week to a 13-month high, though momentum has since turned lower as flows shift back into safe havens
- AUD/EUR rebounded from its 200-week EMA with its strongest week since October, but stalled just beneath the 2025 high (0.6112)
- AUD/GBP shows a similar structure to AUD/EUR, with the rally stalling around 0.53 amid geopolitical uncertainty
- AUD/JPY hit a fresh 36-year high on Friday, though a shooting star and prior rickshaw man doji signalled exhaustion—confirmed by bearish follow-through at the weekly open
- AUD/NZD is showing signs of a potential double top just below 1.22
![AUD/USD and Australian dollar crosses dashboard showing mixed performance on April 20 with pullback from recent highs against USD, JPY and CAD, alongside short-term candlestick trends]](https://micms.stonex.com//sites/default/files/inline-images/image-20260420074932-1.png)
Source: LSEG
Australia This Week: Economic Data and Events for AUD/USD Traders
Geopolitics Driving AUD/USD Sentiment
Middle East headlines remain the primary driver of AUD/USD sentiment, although crude oil prices are the clearest real-time gauge of how negotiations between the US and Iran are progressing—and whether traders expect the Strait of Hormuz to remain open.
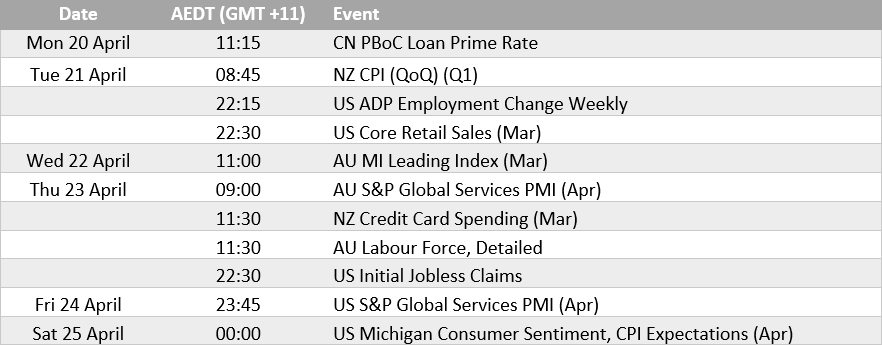
Thin Data Calendar Leaves AUD/USD at the Mercy of Middle East Headlines
From a data perspective, this is one of the lightest economic calendars in recent weeks, particularly for AUD/USD traders. The three Australian releases are unlikely to be major market movers, although the flash PMIs are still worth monitoring for insights into growth and inflation trends—even if they are not typically tradable events.
Last week, Australia’s employment report came in broadly in line with expectations. A total of 17.9k jobs were added, including 52.5k full-time positions, while the unemployment rate held at 4.3%. RBA’s Hauser also delivered hawkish remarks, strongly hinting that further tightening may be required to bring inflation under control.
The latest flare-up in the Middle East only adds to that narrative, reinforcing the case for the RBA to remain on a tightening path.
US Data Secondary to Geopolitical Developments
Attention then shifts to late Friday, when the US releases its flash PMIs and consumer sentiment data. However, their impact will likely depend on developments in the Middle East. In short, any progress towards de-escalation would allow traders to refocus on domestic data and monetary policy expectations. That said, this week’s data is unlikely to materially shift expectations for either the RBA or the Fed—and by extension, the Australian dollar.


AUD/USD Technical Analysis: Australian Dollar vs US Dollar
AUD/USD Correlations
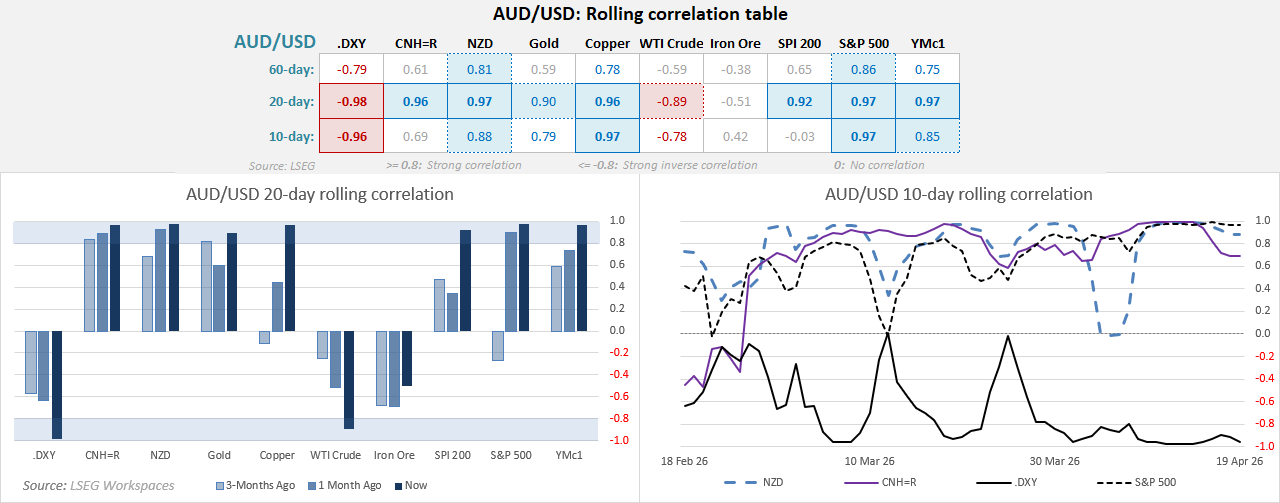
- AUD/USD maintains a strong inverse correlation with the US dollar index (DXY), particularly over the 20-day (-0.98) and 10-day (-0.96) windows, reinforcing that USD direction remains the dominant driver
- Positive correlations with NZD, S&P 500 and SPI 200 remain elevated (≈0.9+ short-term), highlighting AUD’s role as a pro-risk currency tied closely to equity sentiment
- Commodity links are still supportive but slightly less consistent—gold and copper correlations remain firm, while iron ore has weakened and WTI crude holds an inverse relationship
- The sharp rise in short-term correlations (10–20 day) suggests macro drivers have become more aligned recently, with AUD/USD increasingly trading as a clean proxy for global risk appetite rather than idiosyncratic factors
Source: LSEG
AUD/USD Futures Positioning | COT Report
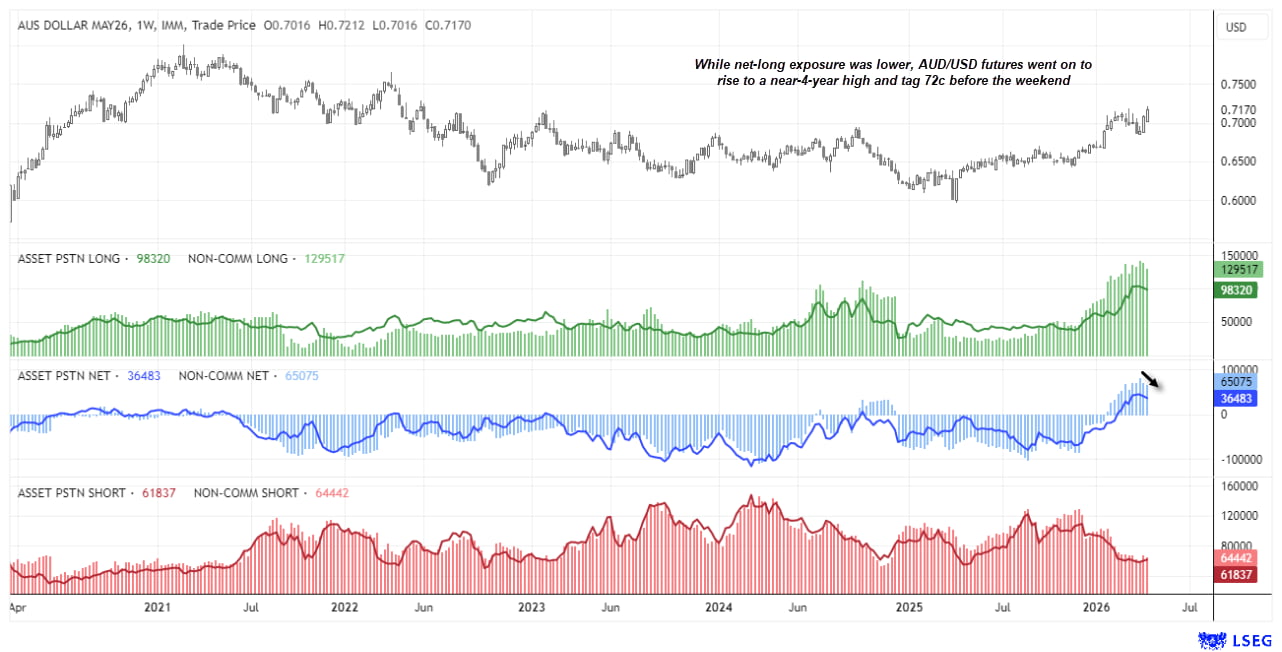
While the weekly Commitment of Traders (COT) report is typically lagged—reflecting positioning as of the prior Tuesday’s close—it is even more so amid the recent geopolitical volatility. AUD/USD rallied to tag 0.72 on Friday, yet net-long exposure fell for a second consecutive week among large speculators and for a third week among asset managers.
The prior surge in gross short exposure from large speculators was also largely unwound, highlighting a degree of indecision beneath the surface of the rally.
With a flurry of conflicting headlines over the weekend regarding the status of the Strait of Hormuz, traders should be prepared for potential gaps at the weekly open. More broadly, price action may continue to run ahead of positioning data in the near term.
Source: CFTC (COT) CME, LSEG
AUD/USD Implied Volatility Drops, But Risks Underpriced
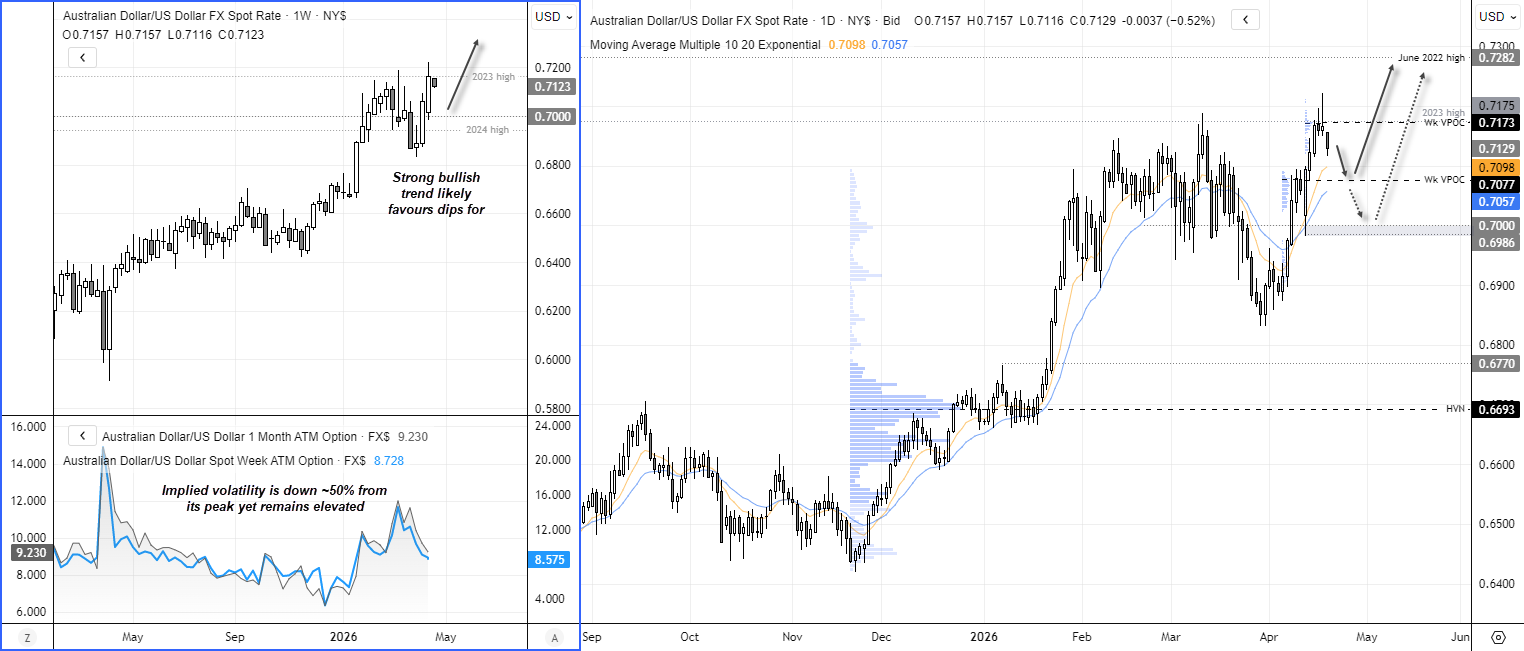
The weekly chart on the left shows implied volatility has fallen by more than 50% from its early March peak. Even so, an annualised rate of 8.57% implies a ~68% probability that AUD/USD will remain within a ~180-pip range (±90 pips) over the next week.
However, as this is based on Friday’s data, I suspect we may be in for a larger move than ±90 pips in either direction.
The daily chart on the right shows Friday’s shooting star (and Thursday’s smaller shooting star) closed back beneath the 2023 high (0.7175). This level also aligns closely with last week’s volume point of control (VPOC), and momentum has since turned lower at today’s open.


AUD/USD has now entered a corrective phase within an otherwise strong bullish trend. I remain constructive on the broader outlook, viewing the latest Middle East setback as a temporary bump in the road that could ultimately pave the way for a more durable agreement—implying this move is likely a pullback rather than a full reversal.
- With the weekly VPOC at 0.7098—sitting between the 10- and 20-day EMAs—0.710 looks a reasonable near-term target for bears. A break below there brings 0.70 into focus.
- However, given the strength of the broader uptrend, dips are likely to be supported while prices hold above the 0.6983 bullish engulfing low.
Source: ICE, LSEG
View the full economic calendar
View the full economic calendar
-- Written by Matt Simpson
Follow Matt on Twitter @cLeverEdge
How to trade with City Index
You can trade with City Index by following these four easy steps:
- Open an account, or log in if you’re already a customer
• Open an account in the UK
• Open an account in Australia
• Open an account in Singapore
- Search for the market you want to trade in our award-winning platform
- Choose your position and size, and your stop and limit levels
- Place the trade
Related tags:


Open an account in minutes
Experience award-winning platforms with fast and secure execution, and enjoy tight spreads from 0.5 pts on FX and 0.3 pts on indices.
Economic calendar
Web Trader platform
Our sophisticated web-based platform is packed with features.
Related articles

AUD/USD Bulls Fight Back After Australian Jobs Shock
AUD/USD has been hit by another ugly Australian employment report, sending RBA rate hike expectations sharply lower. Yet the relationships driving the currency have shifted since quarter-end, and improving risk appetite could provide the fuel for a recovery.

Bitcoin Bulls Eye Weekend Bounce as Nasdaq Finds Support
Bitcoin bulls eye a weekend bounce as Nasdaq finds support, BTC holds $80k and bullish reversal signals emerge alongside stronger correlations.

USD/JPY Update: Can the Japanese Yen Sustain Its Recovery?
Short-term price action around the Japanese yen has started to show some relative improvement over recent sessions. This can be seen in the recent performance of USD/JPY, which has now recorded three consecutive daily declines in favor of the Japanese currency, resulting in a depreciation of roughly 0.35% over the period.

This report is intended for general circulation only. It should not be construed as a recommendation, or an offer (or solicitation of an offer) to buy or sell any financial products. The information provided does not take into account your specific investment objectives, financial situation or particular needs. Before you act on any recommendation that may be contained in this report, independent advice ought to be sought from a financial adviser regarding the suitability of the investment product, taking into account your specific investment objectives, financial situation or particular needs.
StoneX Financial Pte. Ltd., may distribute reports produced by its respective foreign entities or affiliates within the StoneX group of companies or third parties pursuant to an arrangement under Regulation 32C of the Financial Advisers Regulations. Where the report is distributed to a person in Singapore who is not an accredited investor, expert investor or an institutional investor (as defined in the Securities Futures Act), StoneX Financial Pte. Ltd. accepts legal responsibility to such persons for the contents of the report only to the extent required by law. Singapore recipients should contact StoneX Financial Pte. Ltd. at 6826 9988 for matters arising from, or in connection with the report.
In the case of all other recipients of this report, to the extent permitted by applicable laws and regulations neither StoneX Financial Pte. Ltd. nor its associated companies will be responsible or liable for any loss or damage incurred arising out of, or in connection with, any use of the information contained in this report and all such liability is hereby expressly disclaimed. No representation or warranty is made, express or implied, that the content of this report is complete or accurate.
StoneX Financial Pte. Ltd. is not under any obligation to update this report.
Trading CFDs carries a high level of risk that may not be suitable for some investors. Consider your investment objectives, level of experience, financial resources, risk appetite and other relevant circumstances carefully. The possibility exists that you could lose some or all of your investments, including your initial deposits. If in doubt, please seek independent expert advice. Visit www.forex.com/en-sg/terms-and-policies for the complete Risk Disclosure Statement.