



Japanese Yen Price Action Setups: USD/JPY, AUD/JPY, CHF/JPY
USD/JPY risks a deeper pullback below 160, AUD/JPY tests multi-decade highs, and CHF/JPY stalls beneath key resistance at 204.
Share this:

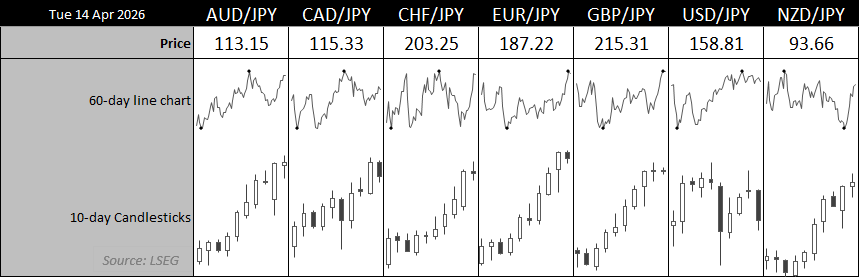
Japanese yen crosses remain active across the board, with divergent setups emerging among the majors. USD/JPY is showing signs of a bearish reversal below 160, AUD/JPY is pressing multi-decade highs, while CHF/JPY continues to stall beneath key resistance at 204. Here’s what the latest price action signals for traders.
View related analysis:
View related analysis:
Japanese Yen (JPY) Overview
Source: ICE, TradingView
USD/JPY Technical Analysis: US Dollar vs Japanese Yen
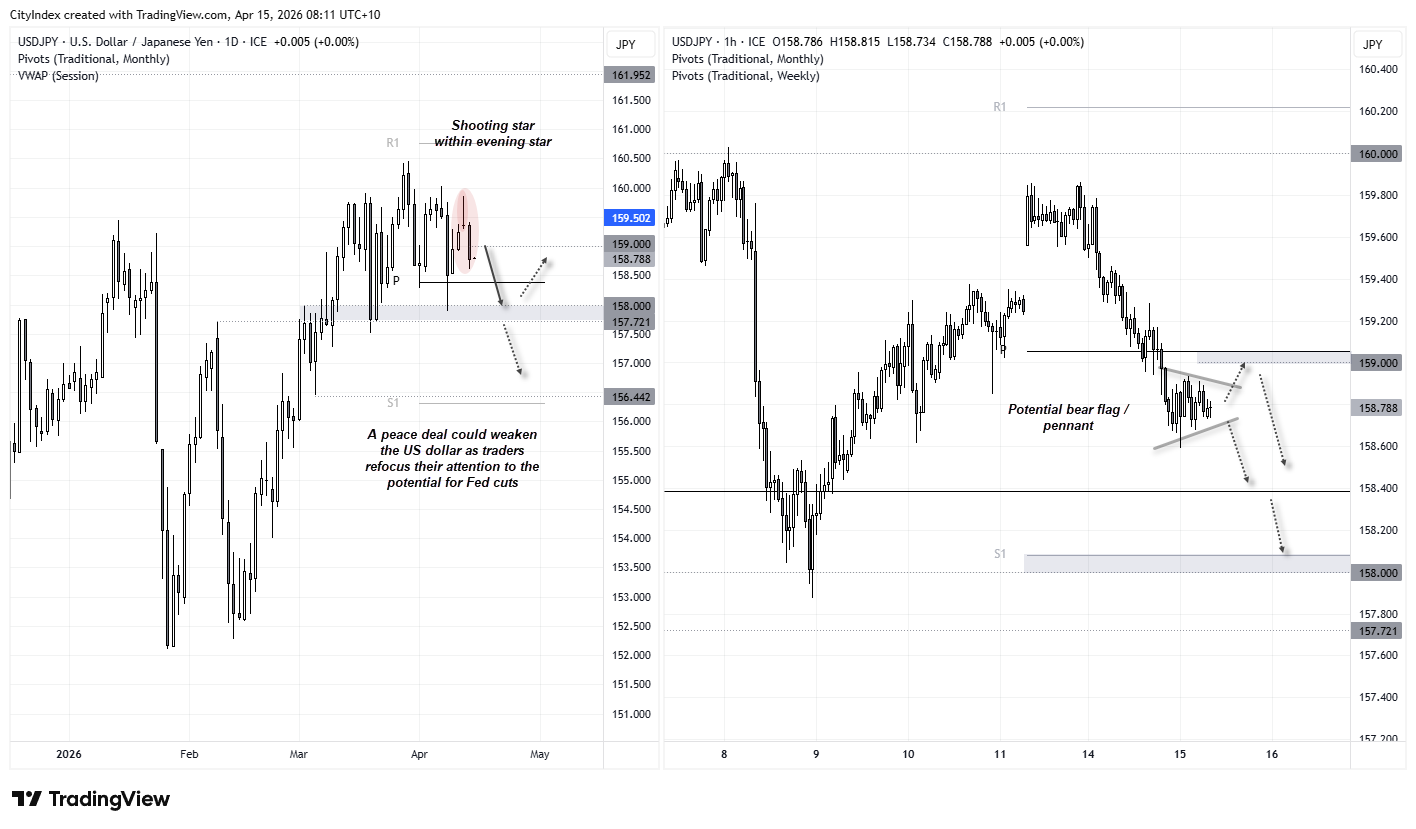
Monday’s shooting star candle marks the second lower high for USD/JPY since March 30, and the second time bulls have failed to push prices to—or above—160. Momentum clearly turned lower on Tuesday, completing a 3-day bearish reversal pattern known as an evening star.
The risk-on backdrop has weighed on the US dollar as traders reprice Fed cuts, allowing the Japanese yen to strengthen against it. I suspect there could be further downside for USD/JPY on anticipation of productive US–Iran talks, even though they have yet to begin.
For me, the key question is whether USD/JPY continues to slide from here, or if we first see a corrective pullback before another leg lower.
- The 4-hour chart shows prices consolidating within a potential flag pattern, hinting at a downside break towards the monthly pivot point (158.38). A break below that level brings the weekly S1 pivot (158.08) and the 158 handle into focus.
- Should prices initially pull back ahead of any downside break, bears could monitor for a potential swing high around the 159 handle or the weekly pivot point (159.06).
Source: ICE, TradingView


AUD/JPY Technical Analysis: Australian Dollar vs Japanese Yen
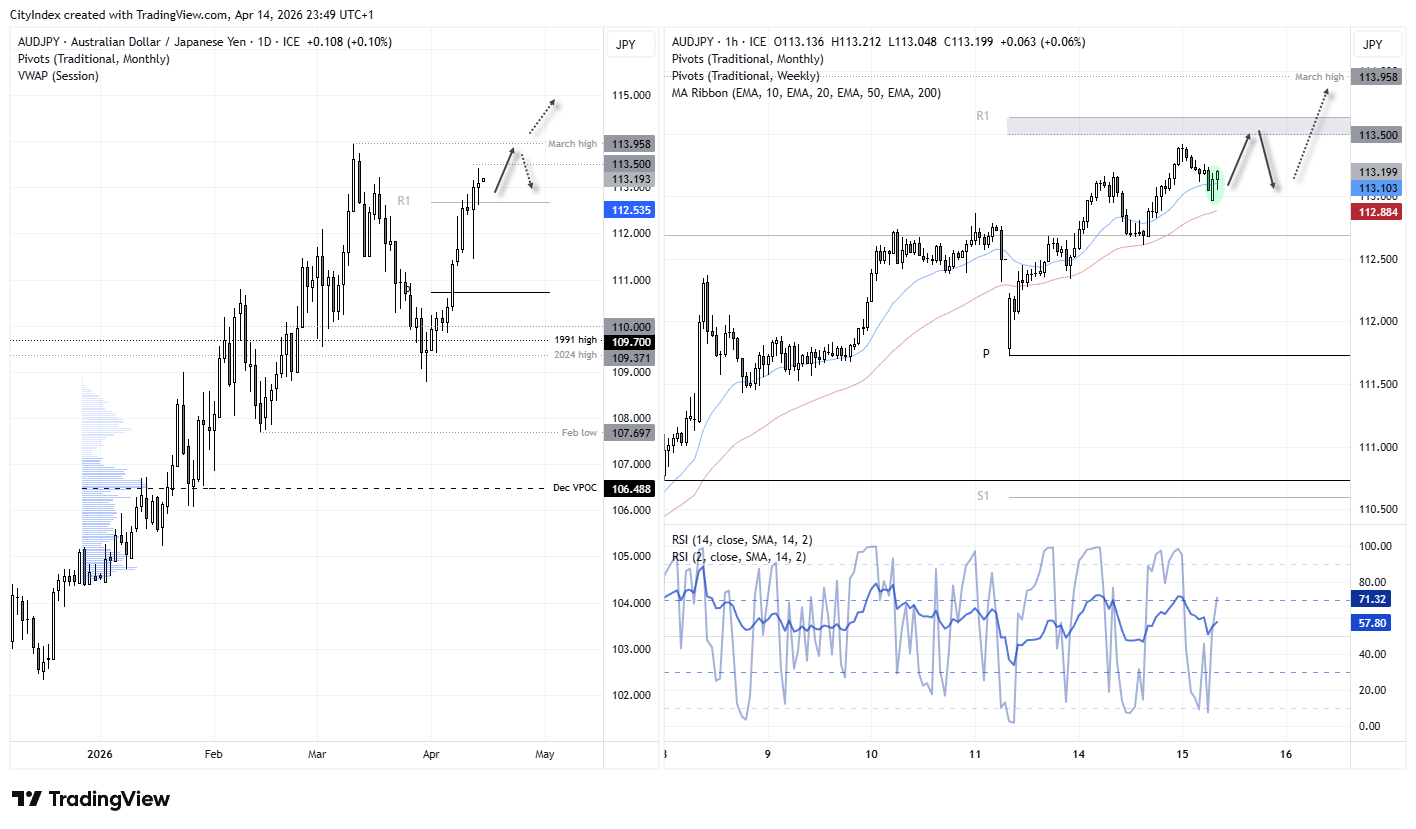
The Australian dollar has been the strongest major FX currency this year, taking full advantage of one of its weakest counterparts—the Japanese yen. This helped AUD/JPY reach a 36-year high of 113.96 in March, and after a brief risk-off wobble, bulls are once again eyeing a breakout.
However, bullish momentum on the daily chart is already starting to wane, even though dips continue to be bought. While this keeps the door open for a move back towards the cycle highs, I suspect we need clear confirmation of a US–Iran peace deal to sustain further upside.
The 1-hour chart shows a potential swing low forming between the 20 and 50 EMAs following a pullback from Tuesday’s high. This could support bulls in the near term, with a move towards 113.50 and the monthly R1 pivot (113.63) in focus.
That said, the pickup in volatility below resistance keeps the risk of a pullback on the table if near-term targets are reached. A confirmed deal is likely required for AUD/JPY to break higher, allowing traders to refocus on the potential for further RBA tightening.
Source: ICE, TradingView


CHF/JPY Technical Analysis: Swiss Franc vs Japanese Yen
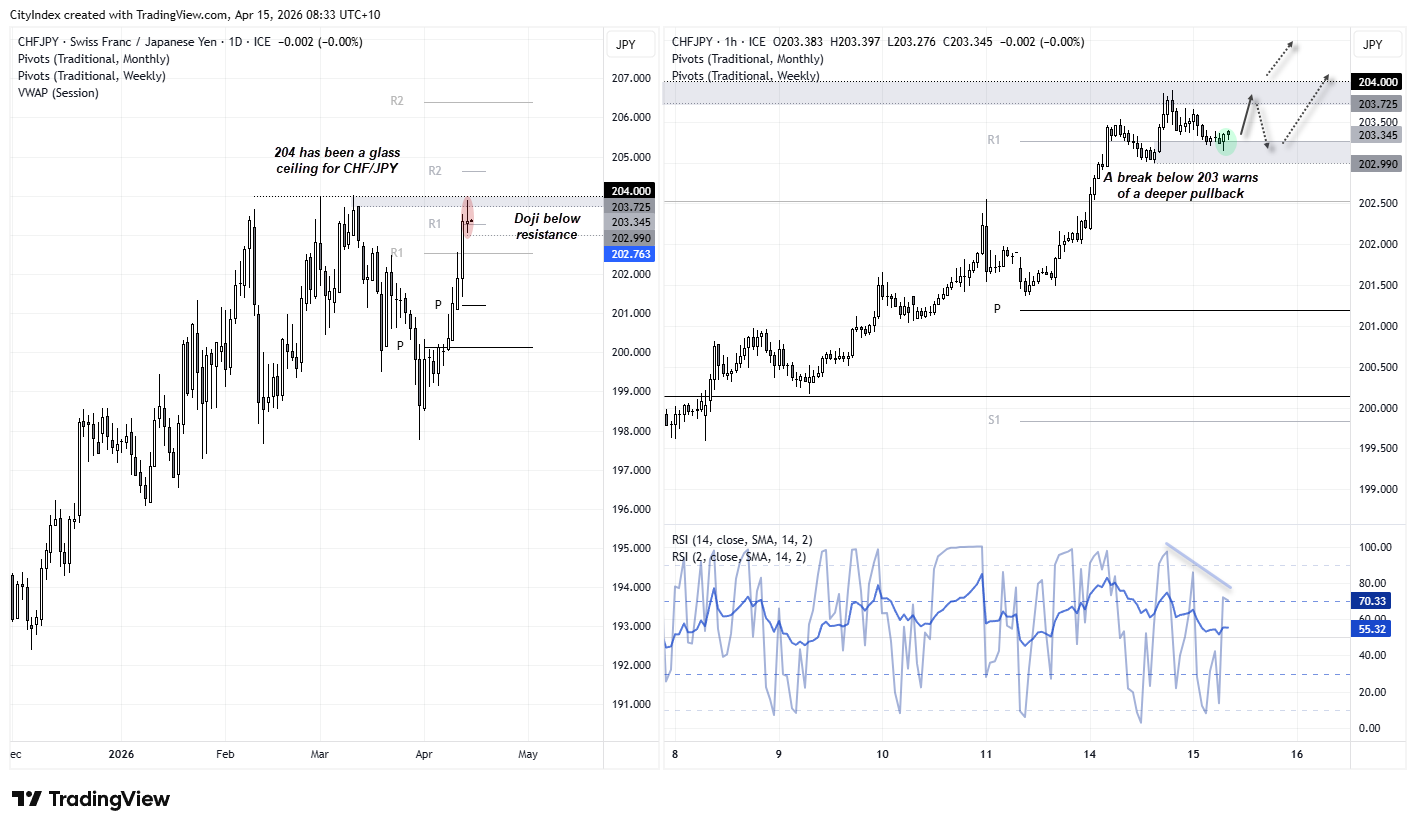
The Swiss franc has dominated the Japanese yen since its March 2025 low, largely shrugging off the threat of currency intervention from Japan’s Ministry of Finance (MOF). Over the past two weeks, CHF/JPY has risen just over 3%, with prices teasing a break above 204. Yet this remains a key level that has repeatedly denied bulls a sustained breakout.
Tuesday’s doji just below this level highlights hesitation among bulls to commit to a breakout. The 1-hour chart shows bullish momentum is waning, although Tuesday’s pullback also leaves the door open for another attempt higher.
Prices are hovering around the weekly R1 pivot, and the recent bullish outside bar points to a potential swing low on this timeframe.
However, given the repeated failures around 204, bulls may once again look to book profits below yesterday’s high. A break below 203 warns of a deeper pullback, while a sustained breakout—or daily close—above 204 is likely required before confirming a resumption of the bullish trend to a new record high.
Source: ICE, TradingView
View the full economic calendar
View the full economic calendar
-- Written by Matt Simpson
Follow Matt on Twitter @cLeverEdge
How to trade with City Index
You can trade with City Index by following these four easy steps:
- Open an account, or log in if you’re already a customer
• Open an account in the UK
• Open an account in Australia
• Open an account in Singapore
- Search for the market you want to trade in our award-winning platform
- Choose your position and size, and your stop and limit levels
- Place the trade
Related tags:



Open an account in minutes
Experience award-winning platforms with fast and secure execution, and enjoy tight spreads from 0.5 pts on FX and 0.3 pts on indices.
Economic calendar
Web Trader platform
Our sophisticated web-based platform is packed with features.
Related articles

Bitcoin Bulls Eye Weekend Bounce as Nasdaq Finds Support
Bitcoin bulls eye a weekend bounce as Nasdaq finds support, BTC holds $80k and bullish reversal signals emerge alongside stronger correlations.

AUD/USD and AUD/JPY Tease Swing Highs Heading into Jobs Report
AUD/USD and AUD/JPY show signs of potential swing highs as bearish reversal candles emerge ahead of Australia's employment report.

USD/CAD, GBP/CAD Price Action Hints at a Potential GBP/USD Bounce
USD/CAD shows signs of exhaustion while GBP/CAD retains a bullish structure, providing clues for a potential GBP/USD rebound ahead of US CPI.
This report is intended for general circulation only. It should not be construed as a recommendation, or an offer (or solicitation of an offer) to buy or sell any financial products. The information provided does not take into account your specific investment objectives, financial situation or particular needs. Before you act on any recommendation that may be contained in this report, independent advice ought to be sought from a financial adviser regarding the suitability of the investment product, taking into account your specific investment objectives, financial situation or particular needs.
StoneX Financial Pte. Ltd., may distribute reports produced by its respective foreign entities or affiliates within the StoneX group of companies or third parties pursuant to an arrangement under Regulation 32C of the Financial Advisers Regulations. Where the report is distributed to a person in Singapore who is not an accredited investor, expert investor or an institutional investor (as defined in the Securities Futures Act), StoneX Financial Pte. Ltd. accepts legal responsibility to such persons for the contents of the report only to the extent required by law. Singapore recipients should contact StoneX Financial Pte. Ltd. at 6826 9988 for matters arising from, or in connection with the report.
In the case of all other recipients of this report, to the extent permitted by applicable laws and regulations neither StoneX Financial Pte. Ltd. nor its associated companies will be responsible or liable for any loss or damage incurred arising out of, or in connection with, any use of the information contained in this report and all such liability is hereby expressly disclaimed. No representation or warranty is made, express or implied, that the content of this report is complete or accurate.
StoneX Financial Pte. Ltd. is not under any obligation to update this report.
Trading CFDs carries a high level of risk that may not be suitable for some investors. Consider your investment objectives, level of experience, financial resources, risk appetite and other relevant circumstances carefully. The possibility exists that you could lose some or all of your investments, including your initial deposits. If in doubt, please seek independent expert advice. Visit www.forex.com/en-sg/terms-and-policies for the complete Risk Disclosure Statement.