





S&P/ASX 200, Hang Seng Analysis: Price Action Setups - 24 April 2025
The ASX 200 rally faces a wall of resistance, and given the declining volumes on the futures market I suspect a pullback could be. The Hang Seng rally meanwhile looks like it may have more to give, assuming it can break above the March low.
Share this:

View related analysis:
- Tentative Signs of a US Dollar Rebound Ahead of Powell speech
- Japanese Yen Analysis: USD/JPY, CAD/JPY, AUD/JPY Price Action Setups
- AUD/USD Rebound Stalls Near 64c, 200-day EMA; PMIs In Focus
- ASX 200 Hang Seng Analysis: Bears Shaken Out From Wall Street Surge
View related analysis:
- Tentative Signs of a US Dollar Rebound Ahead of Powell speech
- Japanese Yen Analysis: USD/JPY, CAD/JPY, AUD/JPY Price Action Setups
- AUD/USD Rebound Stalls Near 64c, 200-day EMA; PMIs In Focus
- ASX 200 Hang Seng Analysis: Bears Shaken Out From Wall Street Surge
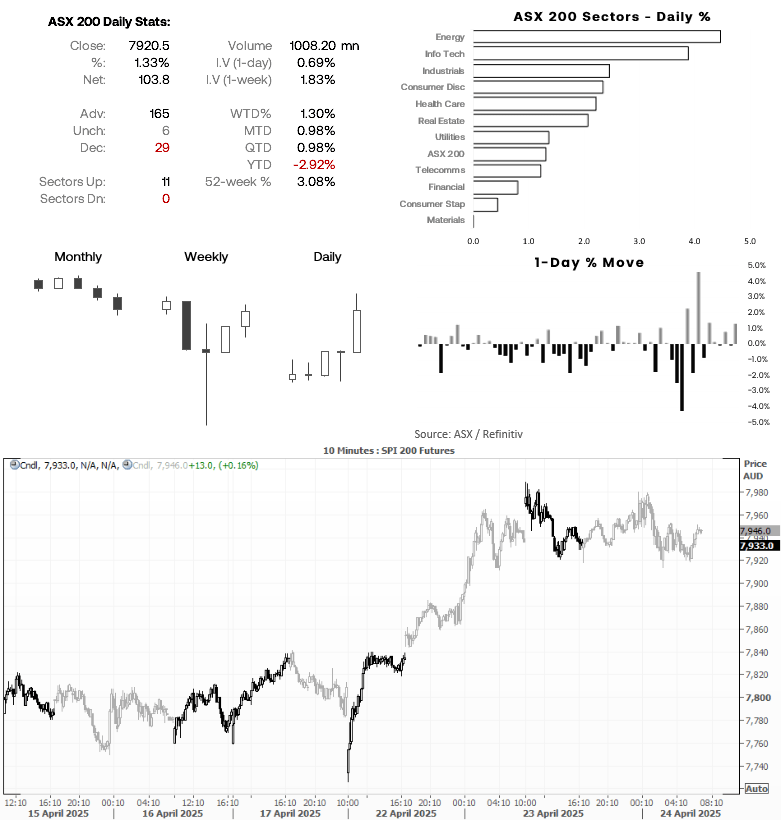
S&P/ASX 200 Index at a Glance (April 23)
- 165 stocks advanced on the S&P/ASX 200 on Wednesday (82.5%), 29 declined (14.5%) and 6 were unchanged (3%) on Tuesday
- All 11 S&P/ASX 200 sectors advanced, led by energy and information technology while materials and consumer staples lagged
- Its 1.3% gain on Tuesday saw the S&P/ASX 200 cash index close to a 13-day high
- However, resistance levels hover nearby at the 8,000 handle, 8015 (march high) and 8051 (December low)
S&P/ASX 200 Technical Analysis
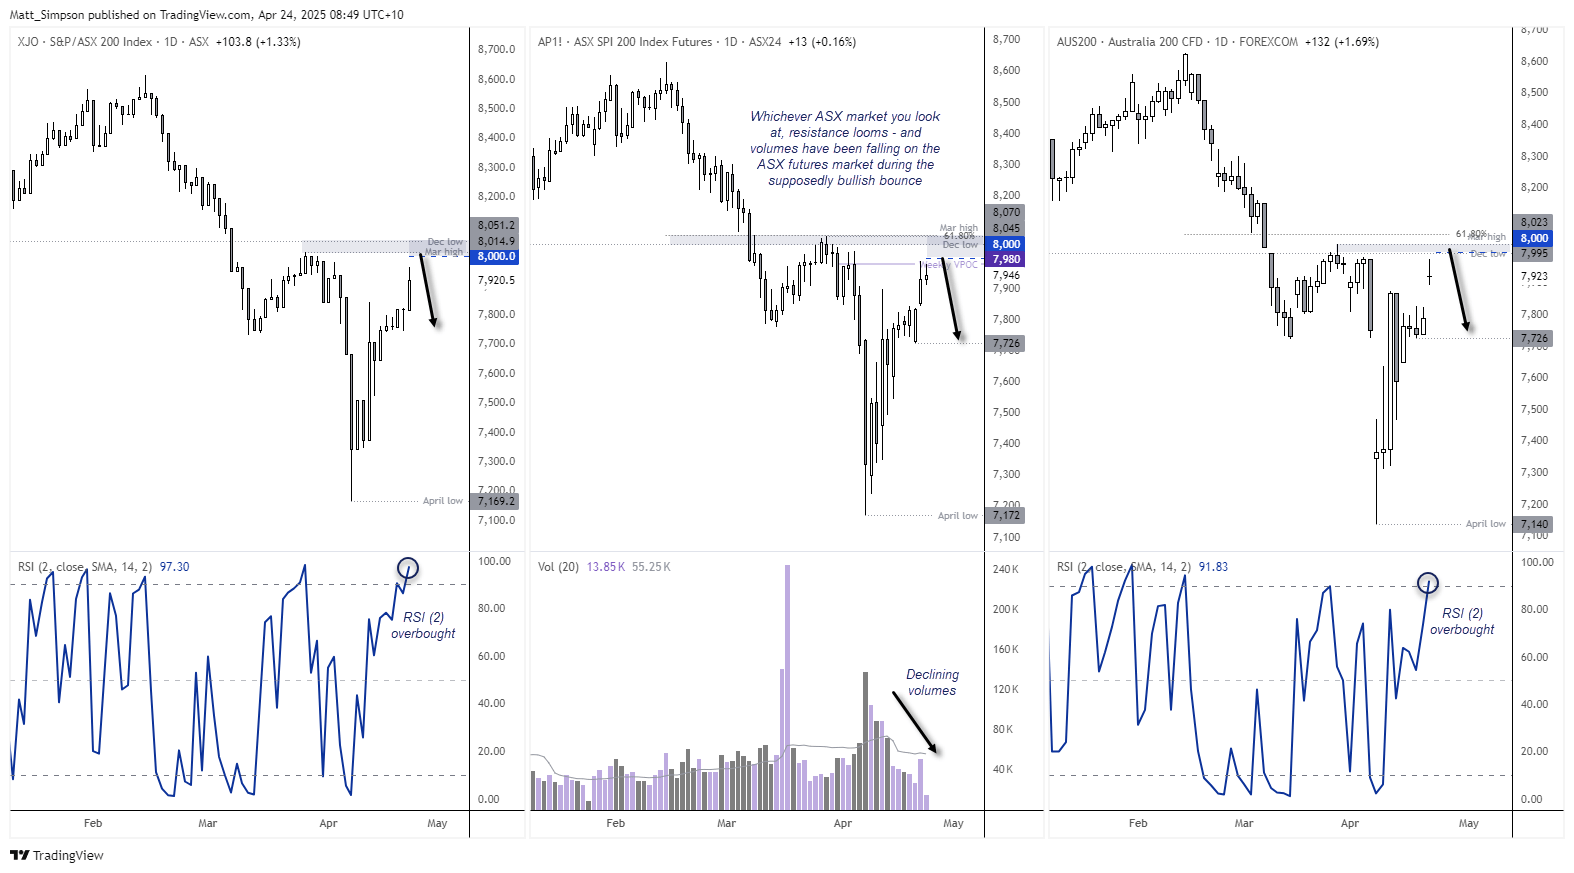
The ASX 200 has risen over since the April low, yet with Wall Street indices seemingly hesitant to extend their Tariff-optimism gains on Wednesday, ASX traders should take note at resistance levels nearby. Not only for the AX cash market, but on the ASX 200 futures market as well (SPI 200).
ASX 200 Cash Index
The cash index is expected to open slightly higher, with ASX futures rising 0.16% overnight. Yet the 8,000 handle looms overhead, just beneath the March high and December low. The daily RSI (2) is also overbought to suggest the ASX is rally is stretched over the near term.
ASX 200 Futures (SPI 200)
The rally on ASX futures has stalled almost perfectly at a historical weekly VPOC (volume point of control), which itself is just shy of the 8,000 handle. Given that the rally has also coincided with diminishing daily trading volumes also suggests the bounce could be corrective. With that said, it is not uncommon for a bounce to materialise on low volumes after a sharp decline as bulls with burned fingers remain sidelined.
Still, with several key resistance levels nearby, my personal preference would to fade into moves towards resistance. Bears could target the 7726 swing low, a break beneath opens up a run for 7500.
AUS200 – Australia 200
This could paint limited upside for the AUS200. Using analysis from the ASX cash and futures markets, bears could seek to fadea into moves towards the 8,000 and use a break above the 61.8% Fibonacci level (8055) to invalidate the near-term bearish bias. A break below 7800 brings the 7726 low into focus, a break beneath which also opens up a run for 7500.
Hang Seng Futures (HSI) Technical Analysis
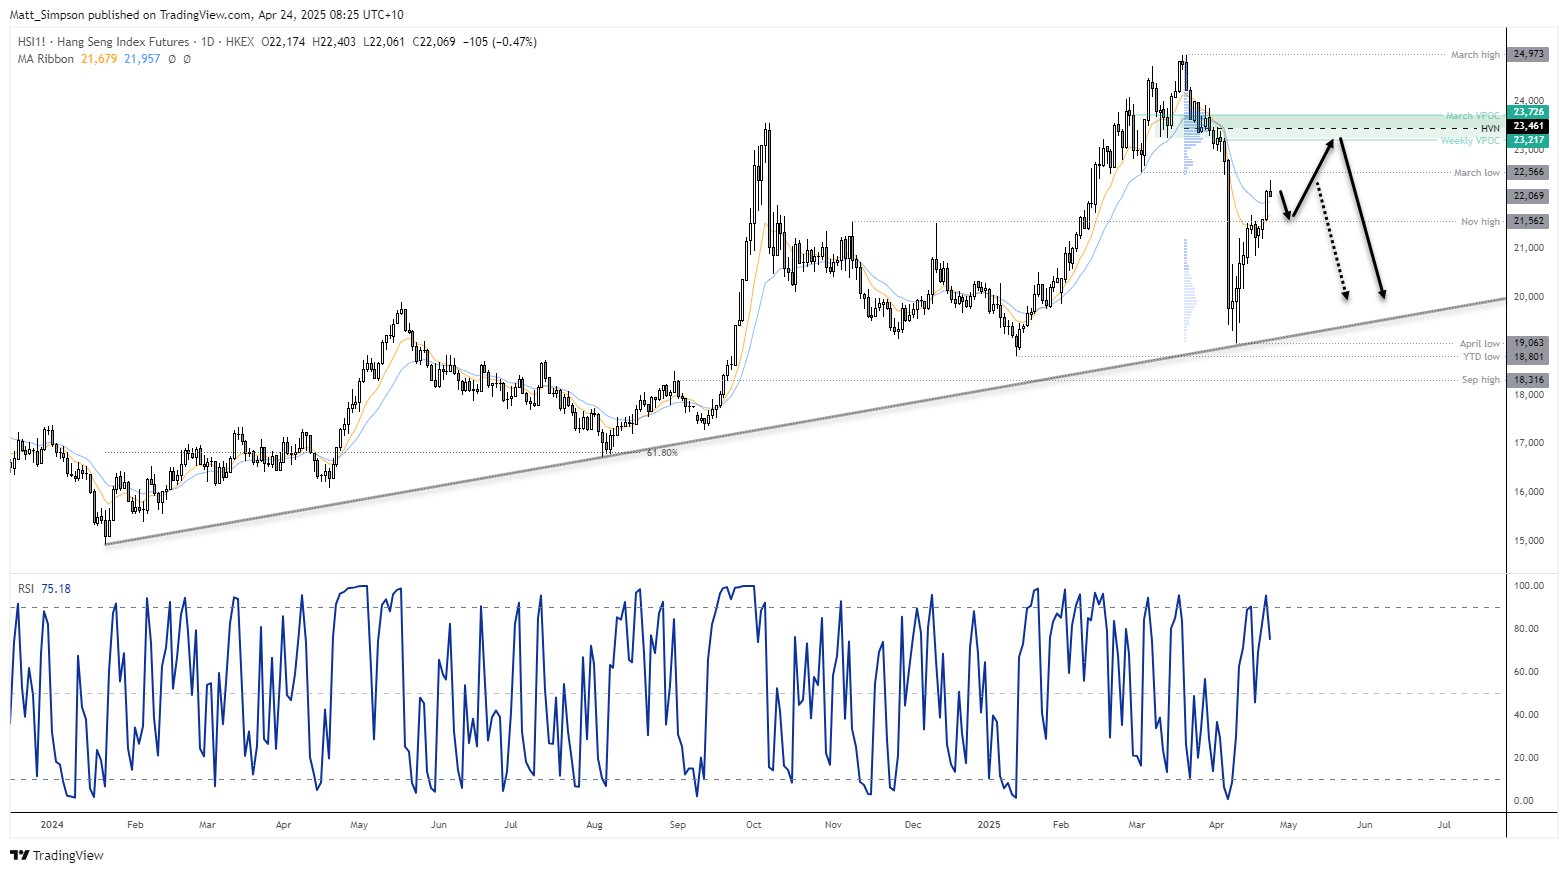
After a 24% decline from the March high in just 13 trading days, Hang Seng futures found support at the January 2024 trendline, just above 19,000. The market has since rebounded 17.5%, and bulls look like they have more to give.
Wednesday’s bullish range expansion day broke out of consolidation and back above the November high, and is less than a day’s typical trading range away from retesting the March low. With prices back above the 10- and 20-day EMAs, and the moving averages turning higher, the preference remains for bulls to seek dips for a move to 20,500. And as the daily RSI (2) reached overbought on Wednesday, a swing low could potentially form around the 10-day EMA and November low, near 21,500, should prices initially retrace lower.
A break above the March low (22,566) brings the weekly and March VPOCs into focus at 22,217 and 23,726 respectively. Also note the high-volume node (HVN) spanning the March high to April low at 23,461, which could also act as a magnet for prices.
Of course, should sentiment around trade optimism sour once more, global indices could be vulnerable to another leg lower. Hang Seng traders should therefore be mindful of a potential swing high around the March high or the volume cluster above 23,000.
-- Written by Matt Simpson
Follow Matt on Twitter @cLeverEdge
How to trade with City Index
You can trade with City Index by following these four easy steps:
- Open an account, or log in if you’re already a customer
• Open an account in the UK
• Open an account in Australia
• Open an account in Singapore
- Search for the market you want to trade in our award-winning platform
- Choose your position and size, and your stop and limit levels
- Place the trade
Related tags:
Latest market news




Open an account in minutes
Experience award-winning platforms with fast and secure execution, and enjoy tight spreads from 0.5 pts on FX and 0.3 pts on indices.
Economic calendar
Web Trader platform
Our sophisticated web-based platform is packed with features.
Related articles
S&P 500, Nasdaq 100 Claw Back But NVDA Cloud Looms Overhead
Last week was green for both the Nasdaq and S&P 500 but given the sell-off that led into that bounce there’s still a very real question as to whether bears still have a statement to make. And the NVDA situation presents a very real threat.

US dollar forecast: USD/JPY and USD/CHF in focus | Forex Friday
Sticky US inflation and a hawkish Fed have kept the dollar firm across the majors, with USD/JPY pressing on the 160 handle. Here are the levels that matter on USD/JPY and USD/CHF as next week's retail sales, Nvidia results and FOMC minutes approach.


Gold outlook: seasonal tailwind offers hope with XAU/USD below $4,000
A historically stronger seasonal window and steady central bank buying are offering gold some hope after its slide to a fresh 2026 low. Reclaiming the 4,000 mark is the first sign that the metal may have found a floor.
This report is intended for general circulation only. It should not be construed as a recommendation, or an offer (or solicitation of an offer) to buy or sell any financial products. The information provided does not take into account your specific investment objectives, financial situation or particular needs. Before you act on any recommendation that may be contained in this report, independent advice ought to be sought from a financial adviser regarding the suitability of the investment product, taking into account your specific investment objectives, financial situation or particular needs.
StoneX Financial Pte. Ltd., may distribute reports produced by its respective foreign entities or affiliates within the StoneX group of companies or third parties pursuant to an arrangement under Regulation 32C of the Financial Advisers Regulations. Where the report is distributed to a person in Singapore who is not an accredited investor, expert investor or an institutional investor (as defined in the Securities Futures Act), StoneX Financial Pte. Ltd. accepts legal responsibility to such persons for the contents of the report only to the extent required by law. Singapore recipients should contact StoneX Financial Pte. Ltd. at 6826 9988 for matters arising from, or in connection with the report.
In the case of all other recipients of this report, to the extent permitted by applicable laws and regulations neither StoneX Financial Pte. Ltd. nor its associated companies will be responsible or liable for any loss or damage incurred arising out of, or in connection with, any use of the information contained in this report and all such liability is hereby expressly disclaimed. No representation or warranty is made, express or implied, that the content of this report is complete or accurate.
StoneX Financial Pte. Ltd. is not under any obligation to update this report.
Trading CFDs carries a high level of risk that may not be suitable for some investors. Consider your investment objectives, level of experience, financial resources, risk appetite and other relevant circumstances carefully. The possibility exists that you could lose some or all of your investments, including your initial deposits. If in doubt, please seek independent expert advice. Visit www.forex.com/en-sg/terms-and-policies for the complete Risk Disclosure Statement.