





AUD/USD bounces with gold, crude oil while USD mean reverts
The USD retraced lower from its 1-year high for a second day, allowing AUD/USD to post a solid bounce from its cycle low. And price action suggest its bounce may not be over just yet.
Share this:

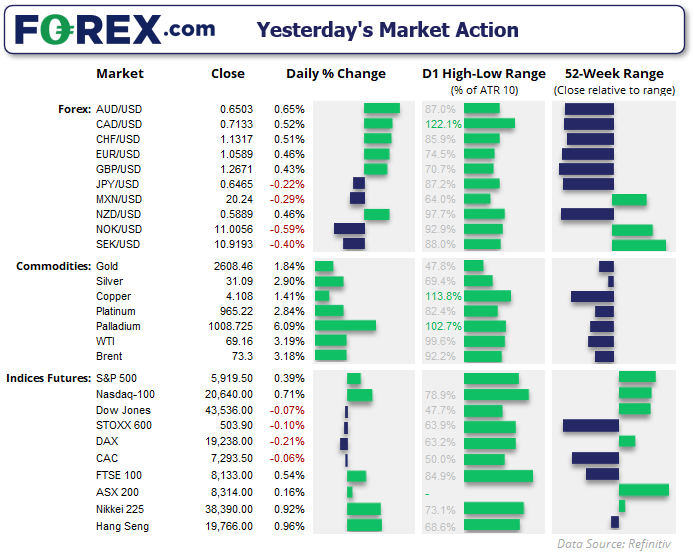
The USD handed back some more of last week's gains on Monday to mark a second day lower from its 1-year peak. This week presents a light economic calendar for the US, which makes Trump's cabinet picks a likely driver for USD sentiment alongside Nvidia's earnings on Wednesday.
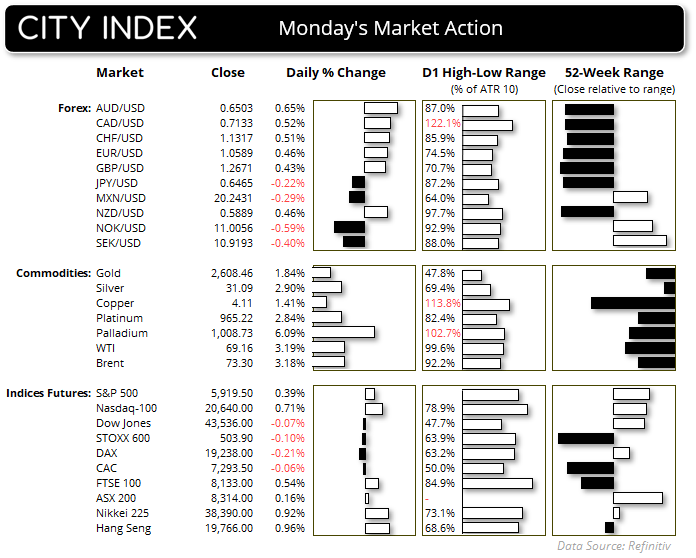
AUD/USD and EUR/USD were the strongest FX majors as mean reversion against the dollar kicked in. The Australian dollar also benefited from a bounce in key commodity prices. Gold attracted safe-haven flows after President Biden announced a long-range missile for Ukraine to reach deeper into Russian territory. News that a Norwegian oilfield had been halted also sent WTI crude oil prices up over 3.3%.
Despite broad USD weakness, it was the Japanese yen which was the weakest major after BOJ Governor Ueda was vague regarding the timing of any interest rate hike. While USD/JPY closed the day 0.25% higher, it remains overshadowed by Friday’s bearish engulfing day of -1.25% when Japan’s Finance Minister pushed back against currency speculators.
Events in focus (AEDT):
- 11:30 – RBA meeting minutes
- 19:45 – ECB Elderson speaks
- 21:00 – EU CPI
- 23:00 – NZ Milk auctions
- 00:30 – US building permits, housing starts
- 00:30 – CA CPI
- 03:30 – USGDPnow
AUD/USD technical analysis:
AUD/USD completed a three-day bullish reversal pattern on Monday (dark cloud cover). That is also formed perfectly at the February low, just above the monthly S1 also adds weigh to the reversal. Moreover, bullish divergences formed on the RSI (2) and RSI (14).
Being bullish AUD/USD is likely not a popular idea. But that tends to be the case at turning points. Also note the strong bullish momentum on the 1-hour chart which suggests further upside potential over the near term. Bulls could seek dips within Monday’s range, such as the 0.6810 high or high-volume node (HVN) at 0.6429.
View the full economic calendar
View the full economic calendar
-- Written by Matt Simpson
Follow Matt on Twitter @cLeverEdge
How to trade with City Index
You can trade with City Index by following these four easy steps:
- Open an account, or log in if you’re already a customer
• Open an account in the UK
• Open an account in Australia
• Open an account in Singapore
- Search for the market you want to trade in our award-winning platform
- Choose your position and size, and your stop and limit levels
- Place the trade
Related tags:


Open an account in minutes
Experience award-winning platforms with fast and secure execution, and enjoy tight spreads from 0.5 pts on FX and 0.3 pts on indices.
Economic calendar
Web Trader platform
Our sophisticated web-based platform is packed with features.
Related articles

USD/CAD forecast: rally could accelerate above June highs at 1.4250
USD/CAD recovered quickly after weaker US jobs data, keeping the bullish trend in focus. A move above the June highs could accelerate the rally as inflation keeps the Fed under pressure.


Dow Jones Slide Shows What Rate Hike Bets Mean for Stocks
The Dow Jones support breakdown shows rising bond yields and rate hike bets hitting U.S. stocks while tech giants prop up the Nasdaq.

EUR/USD forecast remains tilted lower with French bond troubles ahead of US jobs report
The EUR/USD has tagged a fresh year-to-date low as French public-finance concerns trigger a government bond sell-off. Today's US jobs report may change little, with resilient activity, elevated energy prices and hawkish Fed bets keeping the greenback supported. With the pair trapped below resistance at 1.1410, the risk to the near-term EUR/USD forecast is tilted to the downside.
This report is intended for general circulation only. It should not be construed as a recommendation, or an offer (or solicitation of an offer) to buy or sell any financial products. The information provided does not take into account your specific investment objectives, financial situation or particular needs. Before you act on any recommendation that may be contained in this report, independent advice ought to be sought from a financial adviser regarding the suitability of the investment product, taking into account your specific investment objectives, financial situation or particular needs.
StoneX Financial Pte. Ltd., may distribute reports produced by its respective foreign entities or affiliates within the StoneX group of companies or third parties pursuant to an arrangement under Regulation 32C of the Financial Advisers Regulations. Where the report is distributed to a person in Singapore who is not an accredited investor, expert investor or an institutional investor (as defined in the Securities Futures Act), StoneX Financial Pte. Ltd. accepts legal responsibility to such persons for the contents of the report only to the extent required by law. Singapore recipients should contact StoneX Financial Pte. Ltd. at 6826 9988 for matters arising from, or in connection with the report.
In the case of all other recipients of this report, to the extent permitted by applicable laws and regulations neither StoneX Financial Pte. Ltd. nor its associated companies will be responsible or liable for any loss or damage incurred arising out of, or in connection with, any use of the information contained in this report and all such liability is hereby expressly disclaimed. No representation or warranty is made, express or implied, that the content of this report is complete or accurate.
StoneX Financial Pte. Ltd. is not under any obligation to update this report.
Trading CFDs carries a high level of risk that may not be suitable for some investors. Consider your investment objectives, level of experience, financial resources, risk appetite and other relevant circumstances carefully. The possibility exists that you could lose some or all of your investments, including your initial deposits. If in doubt, please seek independent expert advice. Visit www.forex.com/en-sg/terms-and-policies for the complete Risk Disclosure Statement.