



Dow Jones Forecast: DJIA Nears All-Time Highs Once Again
As the new trading week kicks off, a renewed bullish bias is taking hold of the Dow Jones. The index has already rallied nearly 3.00% over the last 3 sessions, creeping back toward key all-time highs.
Share this:

As the new trading week kicks off, a renewed bullish bias is taking hold of the Dow Jones. The index has already rallied nearly 3.00% over the last 3 sessions, creeping back toward key all-time highs. Buying pressure remains strong, fueled by easing geopolitical tensions and falling bond yields, both of which have boosted market confidence. If these tailwinds persist, demand for the DJIA should remain solid in the coming sessions.


Short-Term Confidence Stages a Comeback
The week opened on an optimistic note as Middle East tensions cooled. The US decided to hold off on a new wave of strikes against Iran, while President Trump announced that negotiations would resume this Monday, hoping for concrete breakthroughs in the weeks ahead. If these talks gain traction, further military action could be off the table for now.
This diplomatic shift has worked wonders for market sentiment. The immediate reaction was visible in WTI crude, which dropped notably below the $80 mark, signaling a lower risk premium. This eases uncertainty and shifts appetite back toward risk assets while cooling the demand for safe havens. As a risk-on asset, Dow Jones is directly benefiting from this dynamic. The boost in confidence is already showing up in the Fear and Greed Index, which kicked off the week hovering around 45 points. This pushes the gauge back into "neutral" territory and out of "fear," confirming a mild but meaningful short-term recovery in sentiment.
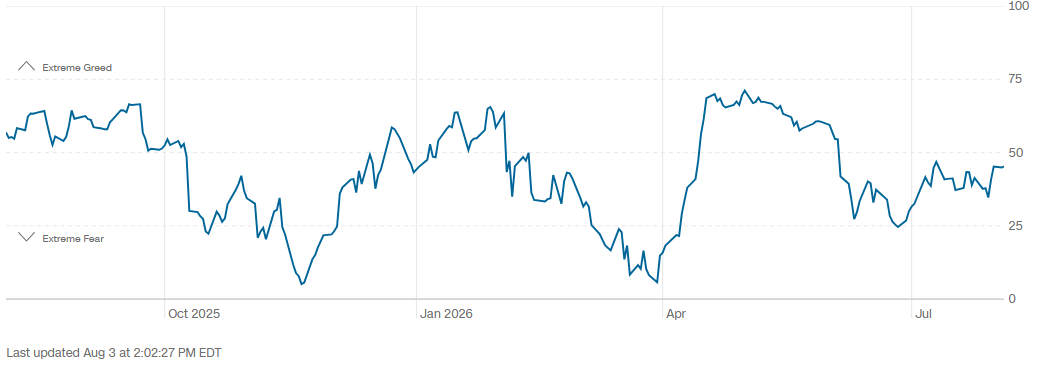
Source: CNN
Bond market dynamics are also playing a major role, especially since fixed income often acts as a safe-haven alternative to Dow Jones. Following last week's Federal Reserve decision, the 10-year Treasury yield continues to slide from its 2026 peaks, now trading below 4.7%. This tells us that the bond market is losing some of its short-term yield appeal, freeing up capital for investors to explore alternatives like equities. A sustained drop in yields reduces the urge to park money in stable assets, paving the way for stronger demand for indices like the Dow Jones. On top of that, bonds are typically used as an inflation hedge, and the positive updates from the Middle East might be further dampening the appetite for these defensive plays.
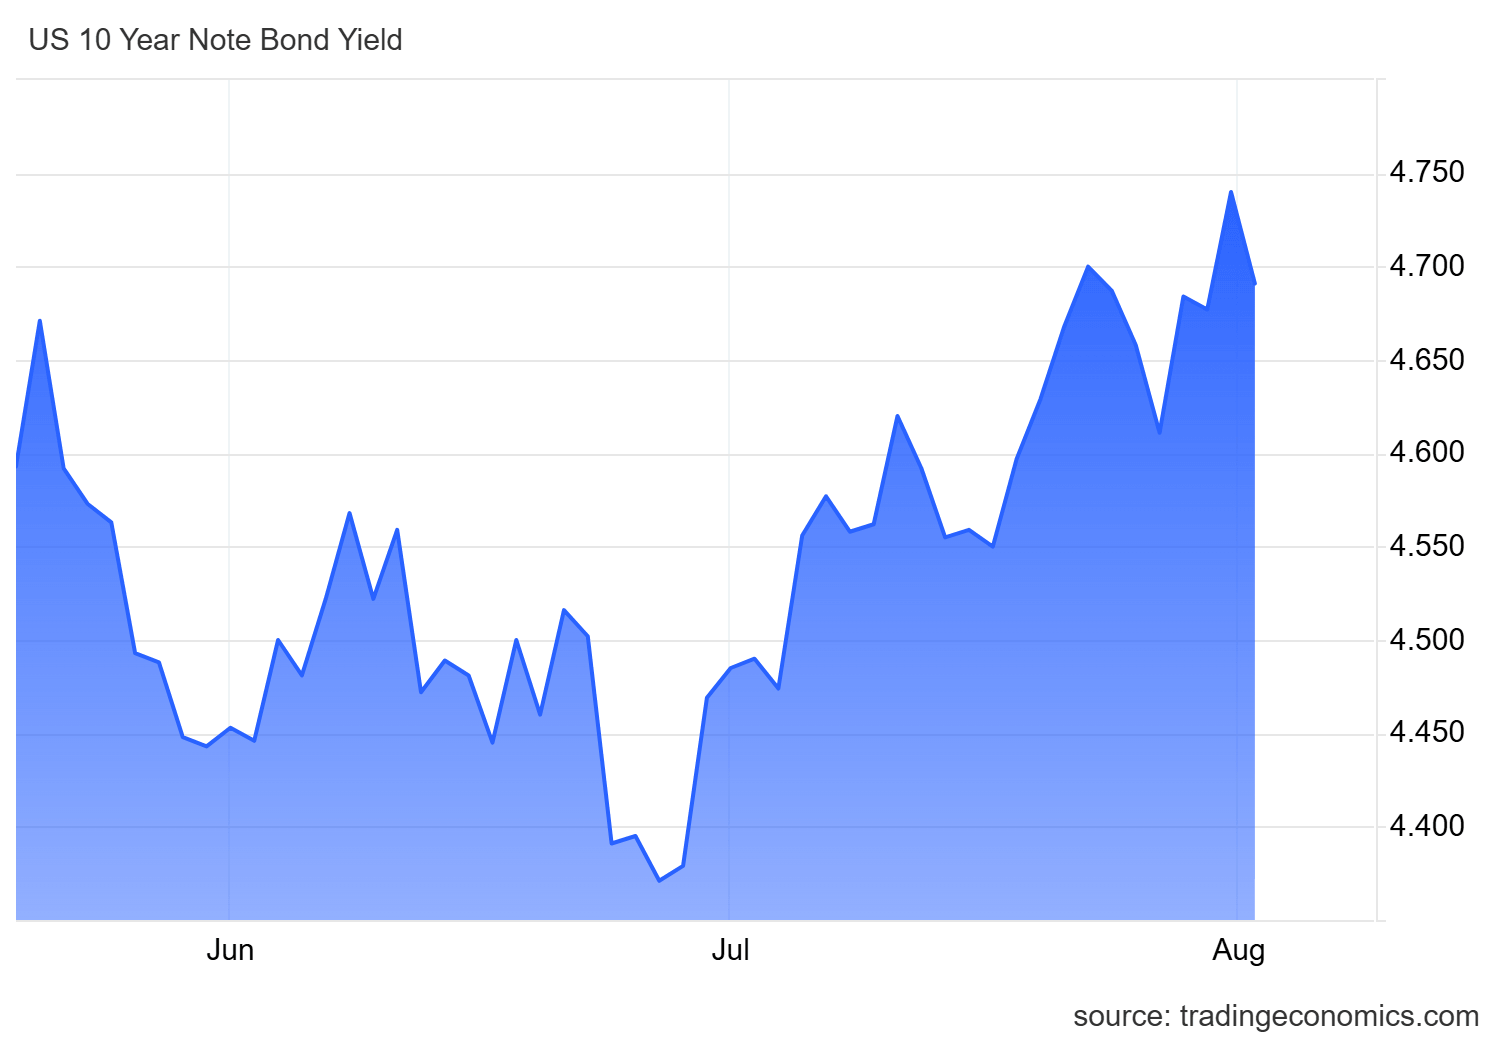
Source: TradingEconomics
With this in mind, the heavyweights in the Dow Jones are holding up quite well. Among the top five most influential stocks in the index, only Amgen is seeing a notable dip of around -1.95%. The rest showing steady resilience, even ahead of tomorrow's Caterpillar earnings report. Strong performances from names like Microsoft, up 5.3% on the day, continue to underpin the index. This stability is largely driven by the short-term confidence boost, which has successfully snapped the losing streak that weighed on the stock market in recent weeks.
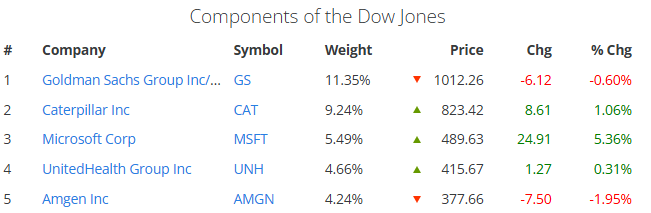
Source: SlickCharts
Moving forward, if falling bond yields and geopolitical optimism hold steady, the need to hide out in safe-haven assets will keep shrinking, leaving plenty of room for equity demand to thrive. This could keep the buying pressure on Dow Jones alive in the coming days. That said, solid corporate earnings are still a must, particularly from Caterpillar. If the index's top performers start flashing noticeable financial red flags, it could trigger a phase of hesitation that stalls the current confidence-driven rally.
Dow Jones Technical Outlook
Source: StoneX, Tradingview
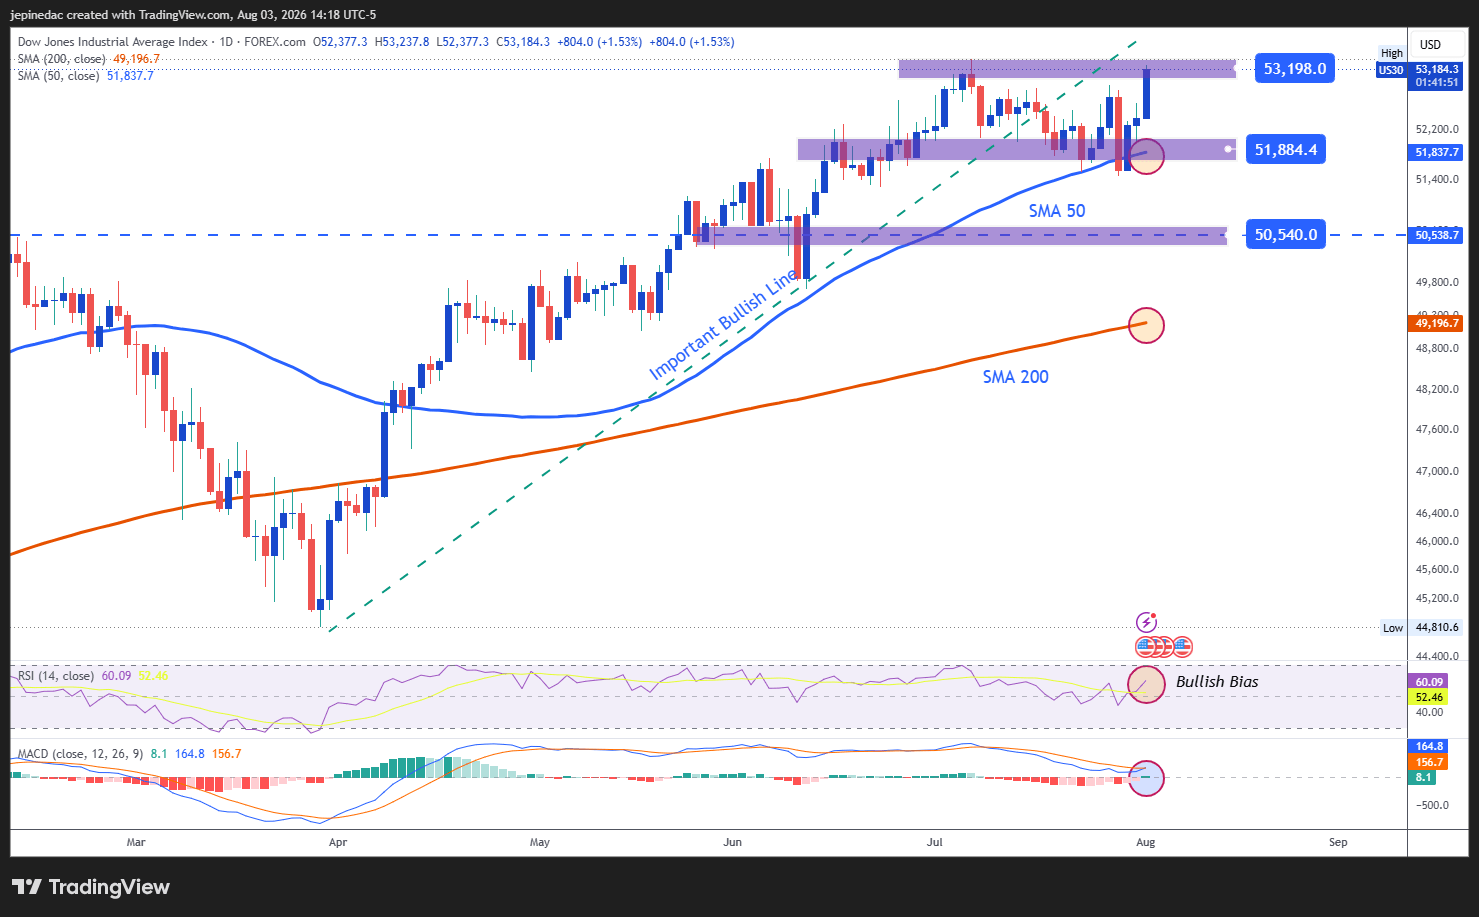
- Bullish momentum sets the tone: The recent price recovery has sparked significant short-term buying pressure. As Dow Jones approaches record highs, this renewed bullish bias could bring a previously relevant uptrend line back into play. If the momentum holds, this technical structure could firm up in the coming sessions.
- RSI: The RSI remains comfortably above the 50 level, reflecting dominant buying momentum over the last 14 sessions. If this holds, short-term bullish pressure should stay intact.
- MACD: However, the MACD histogram is hovering right near the 0 line. This suggests that short-term moving average momentum is in a holding pattern, meaning a slight undercurrent of indecision hasn't entirely left the chart.
Key Levels:
- 53,200 points (Key Resistance): The all-time high zone and the most critical bullish barrier on the chart. A decisive break above this level could unleash a stronger bullish bias and reactivate the uptrend line as the dominant pattern for the coming weeks.
- 51,800 points (Nearby Barrier): This level aligns with the 50-period simple moving average. If price action fails to break cleanly away from this zone, it could lead to persistent neutrality and potentially open space to a short-term sideways range.
- 50,500 points (Key Support): A former resistance zone from previous weeks, now sitting just below the 50-period moving average. A drop to this level could invite a more consistent bearish bias in the weeks ahead.
Written by Julian Pineda, CFA, CMT – Market Analyst
Follow him on: @julianpineda25
Related tags:
Latest market news




Open an account in minutes
Experience award-winning platforms with fast and secure execution, and enjoy tight spreads from 0.5 pts on FX and 0.3 pts on indices.
Economic calendar
Web Trader platform
Our sophisticated web-based platform is packed with features.
Related articles

Indices weekly outlook: Can the DAX rebound turn into a reversal?
Global indices managed to bounce back towards the end of the week as risk mood improved following Thursday’s drop in bond yields and a slight decline in oil prices. But by late Friday afternoon, oil prices had made back most of Thursday’s drop and the bond markets remained under some pressure as European bourses closed for trading.


Dow Jones Forecast: DJIA rises as Oil slips and Treasury yields pause
U.S. stocks are rising on Friday as oil prices ease on signs of reduced Middle East supply risks, although the telecom sector remains under pressure following SpaceX’s acquisition deal.


DAX, Gold and Bitcoin forecast: Dollar falls, yields retreat as risk appetite returns
Markets went from risk off to risk on yesterday afternoon and we have since kicked on with some follow-up buying of stocks, gold and silver, while the dollar has also shown signs of weakness. Risk appetite turned positive after bond yields and oil prices both retreated yesterday.
This report is intended for general circulation only. It should not be construed as a recommendation, or an offer (or solicitation of an offer) to buy or sell any financial products. The information provided does not take into account your specific investment objectives, financial situation or particular needs. Before you act on any recommendation that may be contained in this report, independent advice ought to be sought from a financial adviser regarding the suitability of the investment product, taking into account your specific investment objectives, financial situation or particular needs.
StoneX Financial Pte. Ltd., may distribute reports produced by its respective foreign entities or affiliates within the StoneX group of companies or third parties pursuant to an arrangement under Regulation 32C of the Financial Advisers Regulations. Where the report is distributed to a person in Singapore who is not an accredited investor, expert investor or an institutional investor (as defined in the Securities Futures Act), StoneX Financial Pte. Ltd. accepts legal responsibility to such persons for the contents of the report only to the extent required by law. Singapore recipients should contact StoneX Financial Pte. Ltd. at 6826 9988 for matters arising from, or in connection with the report.
In the case of all other recipients of this report, to the extent permitted by applicable laws and regulations neither StoneX Financial Pte. Ltd. nor its associated companies will be responsible or liable for any loss or damage incurred arising out of, or in connection with, any use of the information contained in this report and all such liability is hereby expressly disclaimed. No representation or warranty is made, express or implied, that the content of this report is complete or accurate.
StoneX Financial Pte. Ltd. is not under any obligation to update this report.
Trading CFDs carries a high level of risk that may not be suitable for some investors. Consider your investment objectives, level of experience, financial resources, risk appetite and other relevant circumstances carefully. The possibility exists that you could lose some or all of your investments, including your initial deposits. If in doubt, please seek independent expert advice. Visit www.forex.com/en-sg/terms-and-policies for the complete Risk Disclosure Statement.