



Euro Price Action Setups: EUR/USD, EUR/JPY, EUR/NZD
EUR/USD threatens another leg lower, EUR/JPY eyes 186, while EUR/NZD consolidates beneath key EMA resistance.
Share this:

The euro is showing mixed technical signals across major crosses, with EUR/USD threatening another leg lower as US dollar correlations strengthen, EUR/JPY attempting to recover from suspected MOF intervention losses, and EUR/NZD consolidating beneath key resistance within a broader downtrend. While near-term rebounds remain possible across several pairs, broader price action still favours selective bearish setups against the euro in the sessions ahead.
View related analysis:
View related analysis:
Euro Technical Outlook: EUR/USD, EUR/JPY and EUR/NZD Setups in Focus
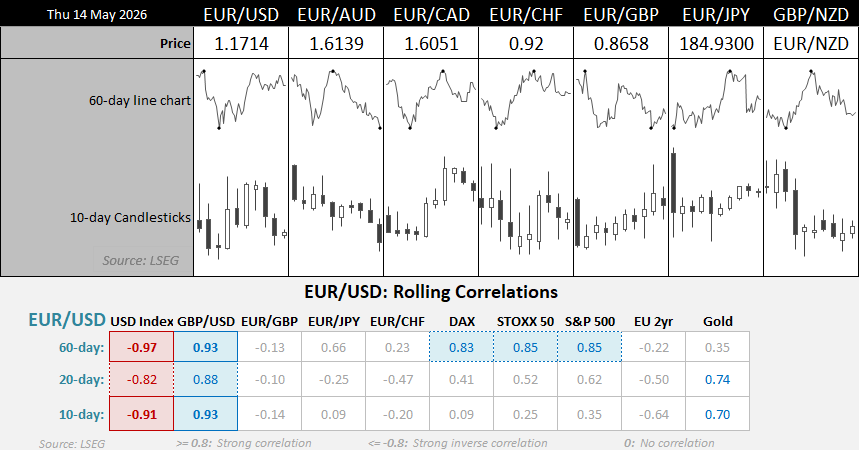
EUR/USD Correlations Show US Dollar Influence Reasserting Itself
- EUR/USD’s inverse correlation with the US dollar index has strengthened back towards its more typical levels, reaching -0.82 over 20 days and -0.91 over 10 days after softening slightly on the 60-day view.
- Strong positive correlations with GBP/USD and European equity indices such as the DAX and STOXX 50 continue to reinforce EUR/USD’s sensitivity to broader risk sentiment and macro expectations.
- Gold correlations have also firmed over shorter timeframes, suggesting inflation and macro themes are again becoming more influential for FX flows.
- Meanwhile, correlations with EUR/GBP and EUR/CHF remain relatively weak, implying the US dollar side of the equation is once again becoming the dominant driver for EUR/USD direction.
Source: LSEG


EUR/USD Technical Analysis: Euro vs US Dollar
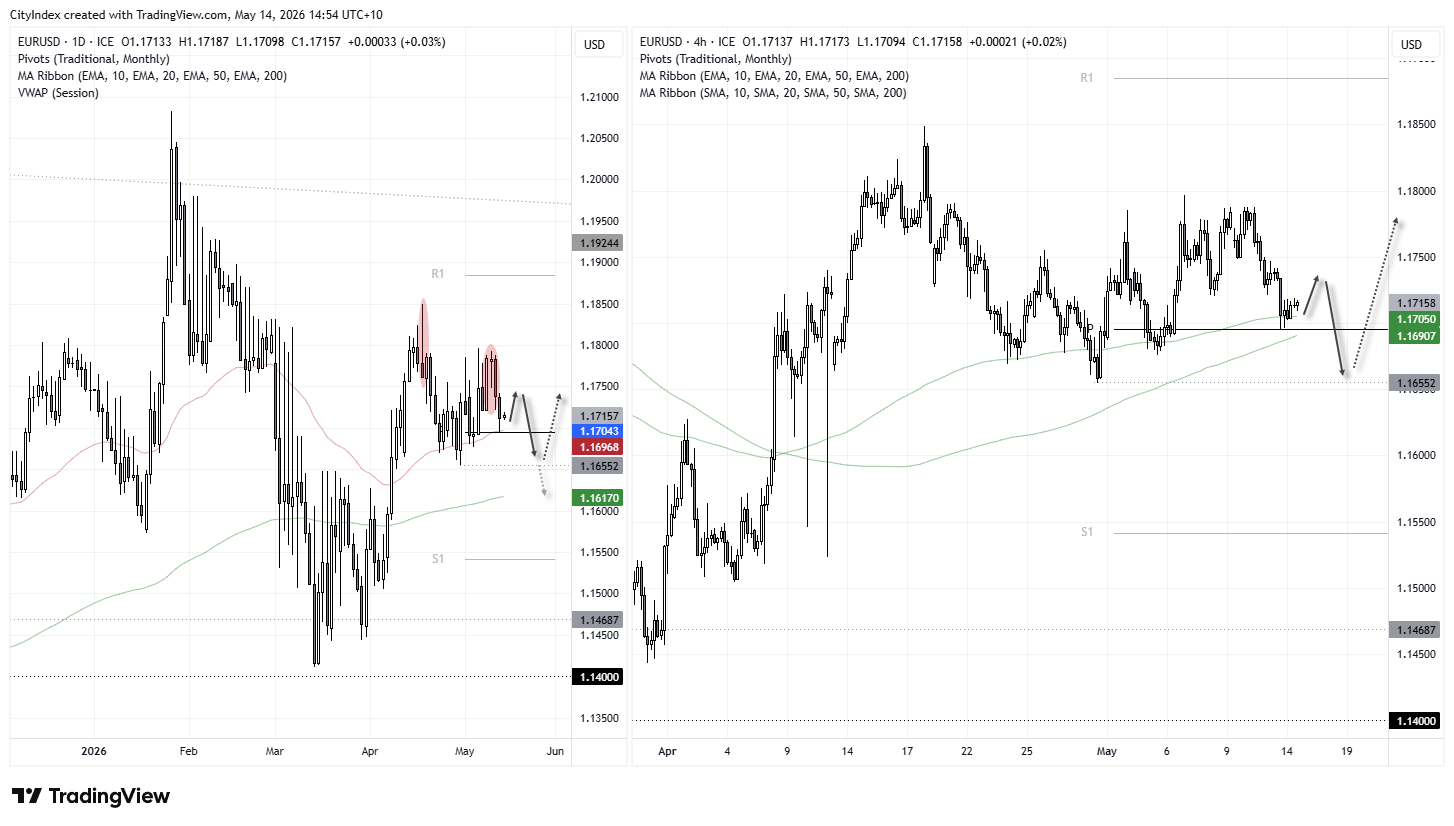
From a pure price action perspective, it appears EUR/USD may be building towards another leg lower. A prominent shooting star formed on April 17, followed by a lower high below 1.18 — including a 3-bar bearish reversal pattern known as a dark cloud cover. Furthermore, momentum appears to be turning lower from within a rough rising channel, which itself could be interpreted as corrective against the prior decline.
If the euro is preparing to roll over, that implies a much stronger US dollar — and my earlier estimate of a rally towards 99 may even prove understated. As always, time will tell.
However, the near term could still see EUR/USD bounce while the US dollar index retraces lower. Wednesday’s low found support at the 50-day EMA (1.1697) and the monthly pivot point near the 1.17 handle. If prices bounce, it could provide bears with a better entry somewhere within Wednesday’s range.
A break below 1.17 brings the 1.1655 low into focus, ahead of the 200-day EMA just above the 1.16 handle.
Source: ICE TradingView
EUR/JPY Technical Analysis: Euro vs Japanese Yen
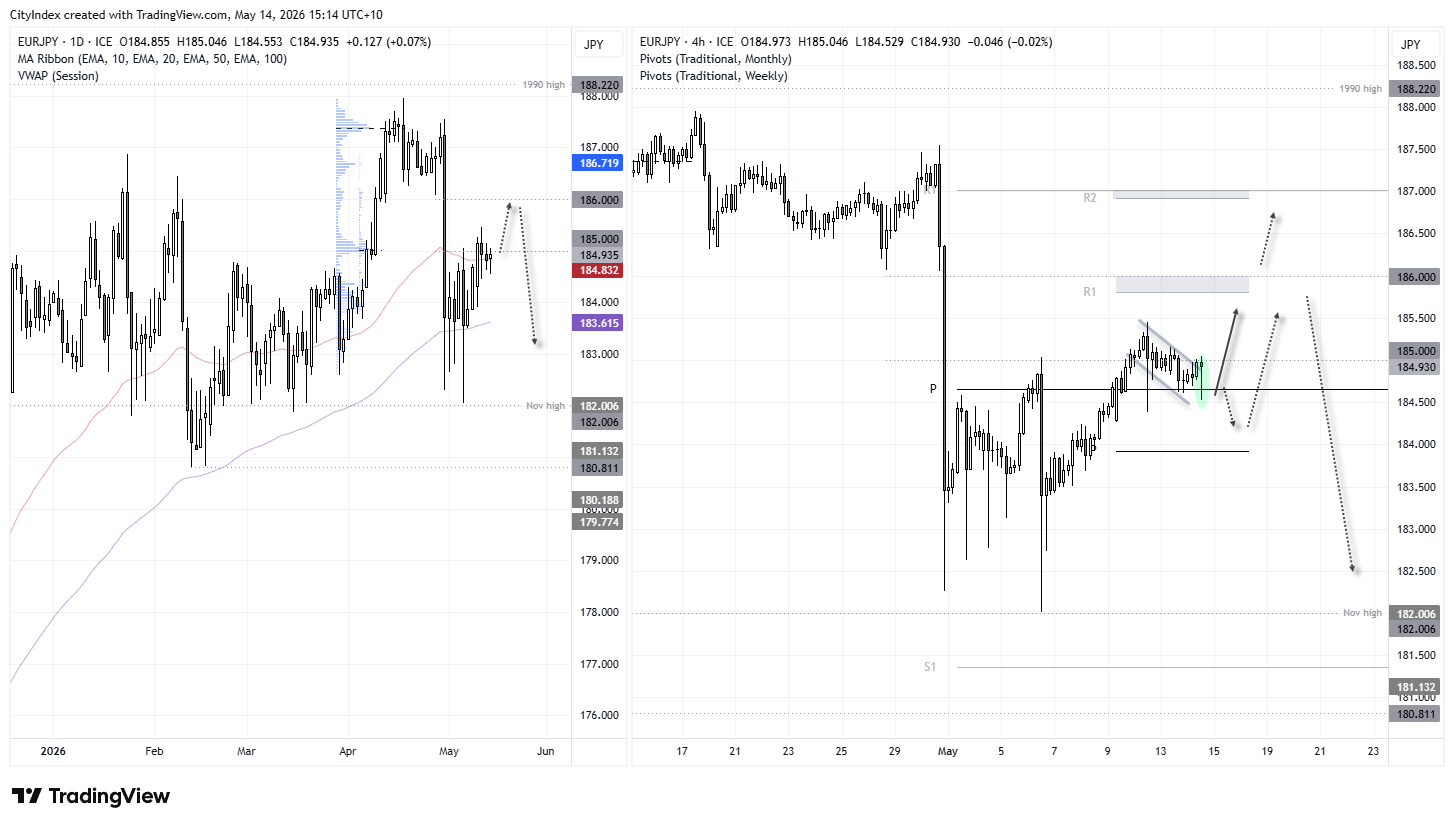
It has been 10 trading days since Japan’s Ministry of Finance (MOF) is strongly suspected to have intervened in the currency market, sending the yen sharply higher. EUR/JPY fell more than 500 pips on the day, although it took four days to print a cycle low just above 182. The cross has since recouped around half of those losses, which has allowed the 1-hour chart to develop a decent uptrend.
I’m not yet convinced the trend will fully reverse the intervention-led losses, but the structure is constructive enough to hint at least one more leg higher.
The 1-hour chart shows prices have pulled back to the monthly pivot point and are on track to form a bullish hammer. The mild retracement from Tuesday’s high also suggests EUR/JPY is trying to build energy for another burst higher.
Ultimately, dips are favoured while volatility remains low, with EUR/JPY potentially heading towards 186 over the near term. Whether it can continue higher likely depends on the MOF and whether they feel the need to intervene again for what could be a third time.
Source: ICE TradingView


EUR/NZD Technical Analysis: Euro vs New Zealand Dollar
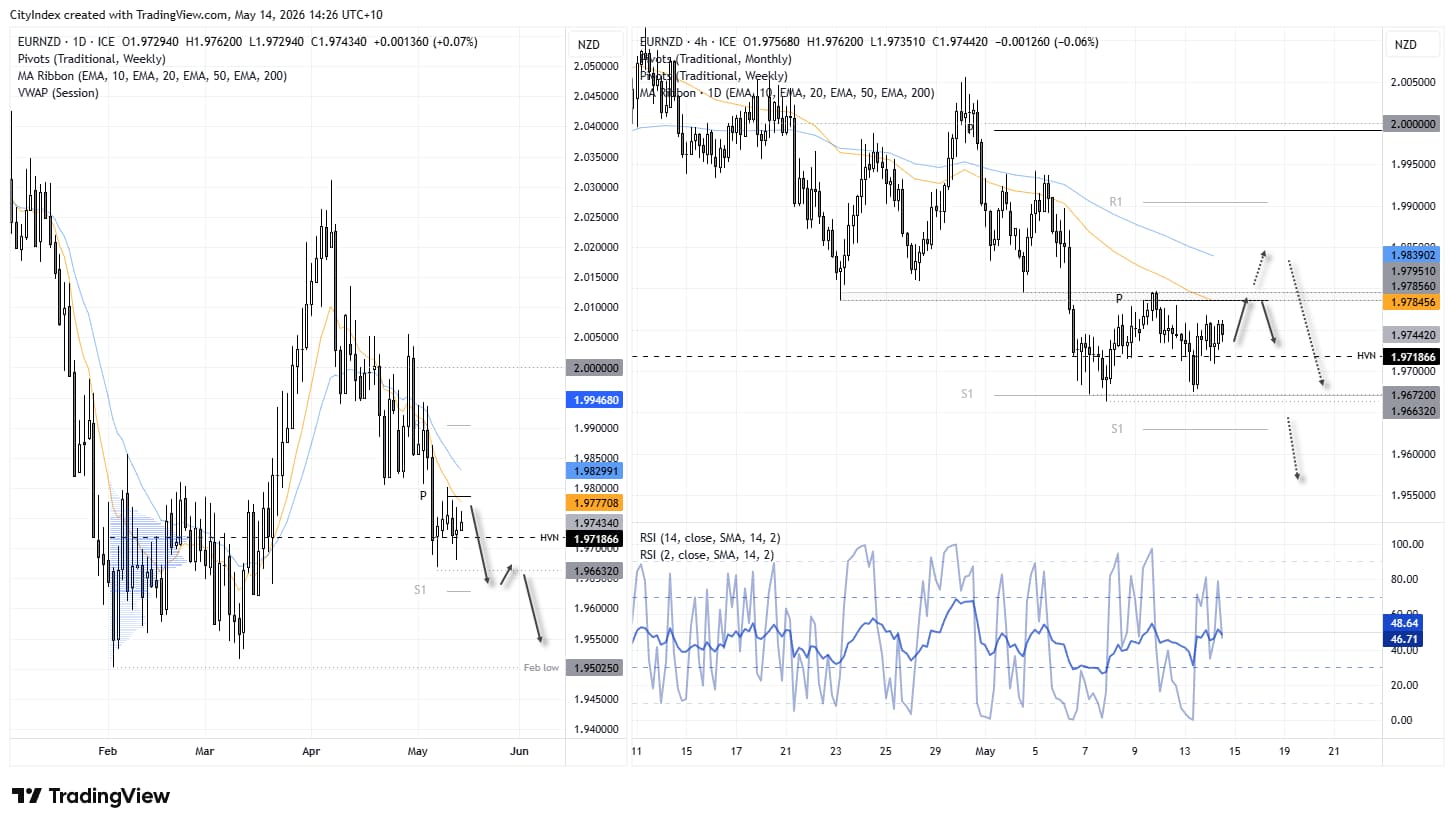
The euro has been within an established downtrend on the daily chart since April, with a prominent lower high forming around 2.0 at the beginning of May. Yet prices have since entered a sideways consolidation, which has interestingly seen the open and closing prices respect the high-volume node (HVN) from the February–March consolidation phase. Recent lows have also formed around the monthly R1 pivot point.
And with Wednesday’s doji forming a higher low, perhaps momentum can temporarily turn higher. But unless bulls can truly regain control, I suspect EUR/NZD could be headed back towards the February low.
For now, bears can either wait for evidence of a swing high around resistance — whether it be the 10-day EMA, 20-day EMA, or weekly pivot point.
Source: ICE TradingView
View the full economic calendar
View the full economic calendar
-- Written by Matt Simpson
Follow Matt on Twitter @cLeverEdge
How to trade with City Index
You can trade with City Index by following these four easy steps:
- Open an account, or log in if you’re already a customer
• Open an account in the UK
• Open an account in Australia
• Open an account in Singapore
- Search for the market you want to trade in our award-winning platform
- Choose your position and size, and your stop and limit levels
- Place the trade
Related tags:



Open an account in minutes
Experience award-winning platforms with fast and secure execution, and enjoy tight spreads from 0.5 pts on FX and 0.3 pts on indices.
Economic calendar
Web Trader platform
Our sophisticated web-based platform is packed with features.
Related articles

Nasdaq 100 Coils Ahead of ASML Earnings as AI Leadership Faces a Test
The Nasdaq 100 consolidates ahead of ASML earnings as leadership fades, market breadth improves and traders await fresh clues on AI demand.
Nasdaq 100 Bulls Seek Swing Low, Though COT Positioning Lacks Conviction
Nasdaq 100 futures are trying to establish a swing low, but COT positioning shows traders remain cautious despite improving technical signals.

Crude Oil Finds Support at Its Pre-War Close, Gold Bounces and USD Retreats
Crude oil has surrendered all post-war gains, but key support, stretched positioning, a weaker US dollar and rebounding gold point to a potential recovery.
This report is intended for general circulation only. It should not be construed as a recommendation, or an offer (or solicitation of an offer) to buy or sell any financial products. The information provided does not take into account your specific investment objectives, financial situation or particular needs. Before you act on any recommendation that may be contained in this report, independent advice ought to be sought from a financial adviser regarding the suitability of the investment product, taking into account your specific investment objectives, financial situation or particular needs.
StoneX Financial Pte. Ltd., may distribute reports produced by its respective foreign entities or affiliates within the StoneX group of companies or third parties pursuant to an arrangement under Regulation 32C of the Financial Advisers Regulations. Where the report is distributed to a person in Singapore who is not an accredited investor, expert investor or an institutional investor (as defined in the Securities Futures Act), StoneX Financial Pte. Ltd. accepts legal responsibility to such persons for the contents of the report only to the extent required by law. Singapore recipients should contact StoneX Financial Pte. Ltd. at 6826 9988 for matters arising from, or in connection with the report.
In the case of all other recipients of this report, to the extent permitted by applicable laws and regulations neither StoneX Financial Pte. Ltd. nor its associated companies will be responsible or liable for any loss or damage incurred arising out of, or in connection with, any use of the information contained in this report and all such liability is hereby expressly disclaimed. No representation or warranty is made, express or implied, that the content of this report is complete or accurate.
StoneX Financial Pte. Ltd. is not under any obligation to update this report.
Trading CFDs carries a high level of risk that may not be suitable for some investors. Consider your investment objectives, level of experience, financial resources, risk appetite and other relevant circumstances carefully. The possibility exists that you could lose some or all of your investments, including your initial deposits. If in doubt, please seek independent expert advice. Visit www.forex.com/en-sg/terms-and-policies for the complete Risk Disclosure Statement.