





European Open Is The Sell Off Losing Steam or Just Pausing For Breath
Whilst risk assets remained under pressure, there are signs that the risk-off tone has softened as bearish volatility remains on the low side.
Share this:

View related analysis:
- GBP/AUD Eyes 2020 High, Inflation Reports on Tap
- Nasdaq 100, S&P 500 Forecast: Bring Your Quarter to the Slaughter?
- AUD/USD, USD/CAD Price Action Clues Could Bode Well for AUD/CAD Bears
View related analysis:
- GBP/AUD Eyes 2020 High, Inflation Reports on Tap
- Nasdaq 100, S&P 500 Forecast: Bring Your Quarter to the Slaughter?
- AUD/USD, USD/CAD Price Action Clues Could Bode Well for AUD/CAD Bears
As we await President Trump’s speech and the rollout of his well-telegraphed tariffs, I want to focus on a pair that is less correlated to the risk-on, risk-off moves that could unfold over the next 24 hours—and potentially beyond.
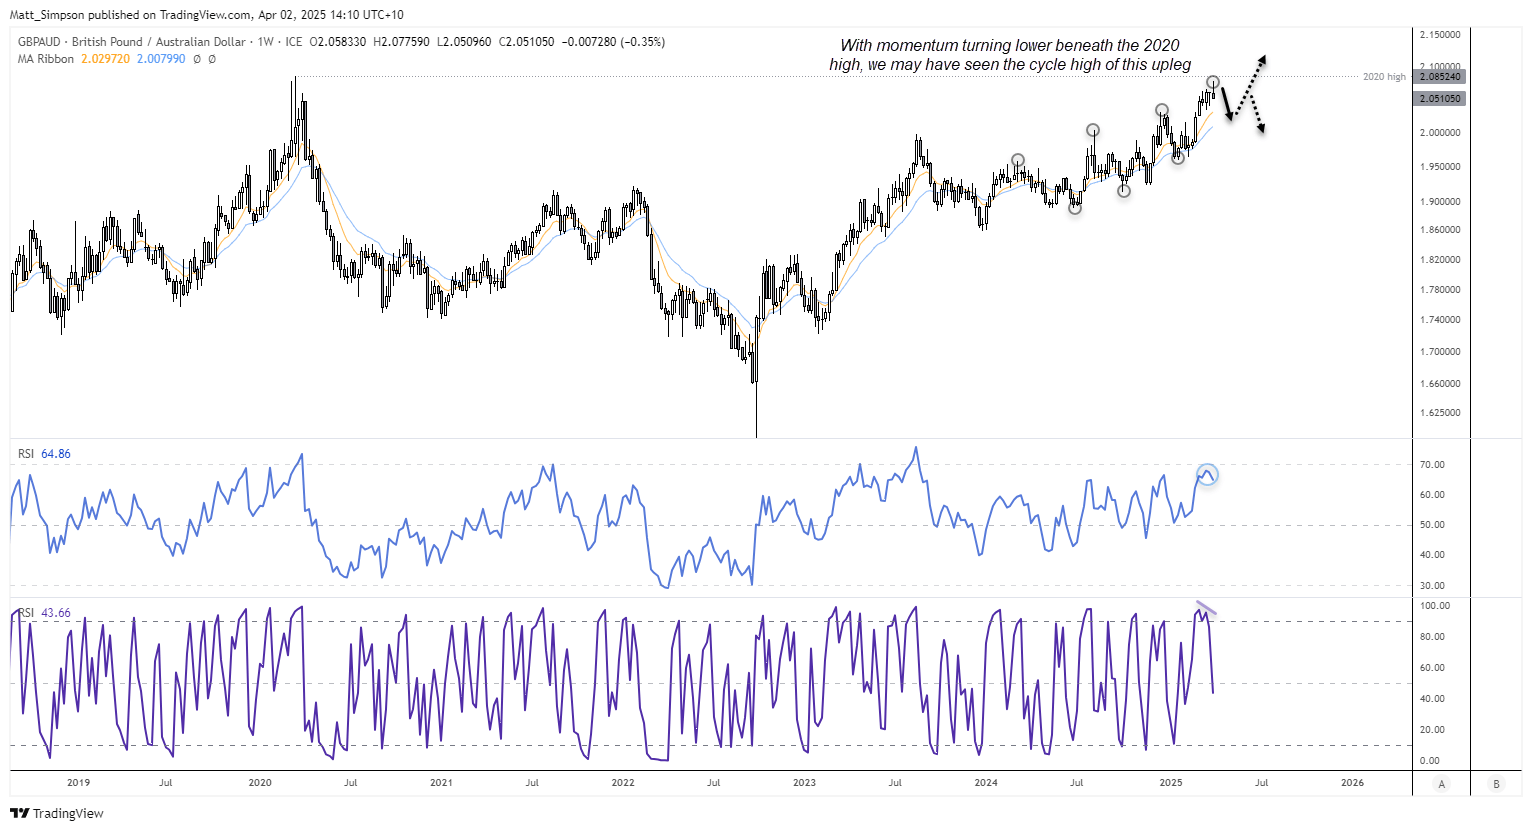
Last week, I outlined a near-term bullish bias for GBP/USD, alongside a higher-timeframe call for some mean reversion. The first of those objectives was met on Monday, with GBP/AUD reaching a five-year high and stopping just short of the 2020 high by less than a typical day’s trading range. But with momentum turning lower, I’m now ready to focus on the potential for mean reversion on the weekly timeframe.
GBP/AUD Technical Analysis (Weekly Chart)
While GBP/USD is clearly in a strong uptrend on the weekly chart, we’re seeing the familiar pattern of a market stalling just ahead of a milestone level—in this case, the 2020 high. Prices are extended from the 10- and 20-week EMAs, and the general oscillation of the trend already suggests that GBP/AUD could be nearing a cycle high on this timeframe. The weekly RSI (2) has formed a small bearish divergence, warning of potential mean reversion.
However, given that the weekly trend remains bullish, the RSI (14) is confirming the trend, and it has not yet reached overbought territory, I believe this market could eventually break above the 2020 high after the anticipated pullback.
For now, the bias is for some mean reversion on the weekly timeframe, potentially down to the 10-week SMA (2.0968), the 20-week SMA (2.0078), or the 2.000 handle.
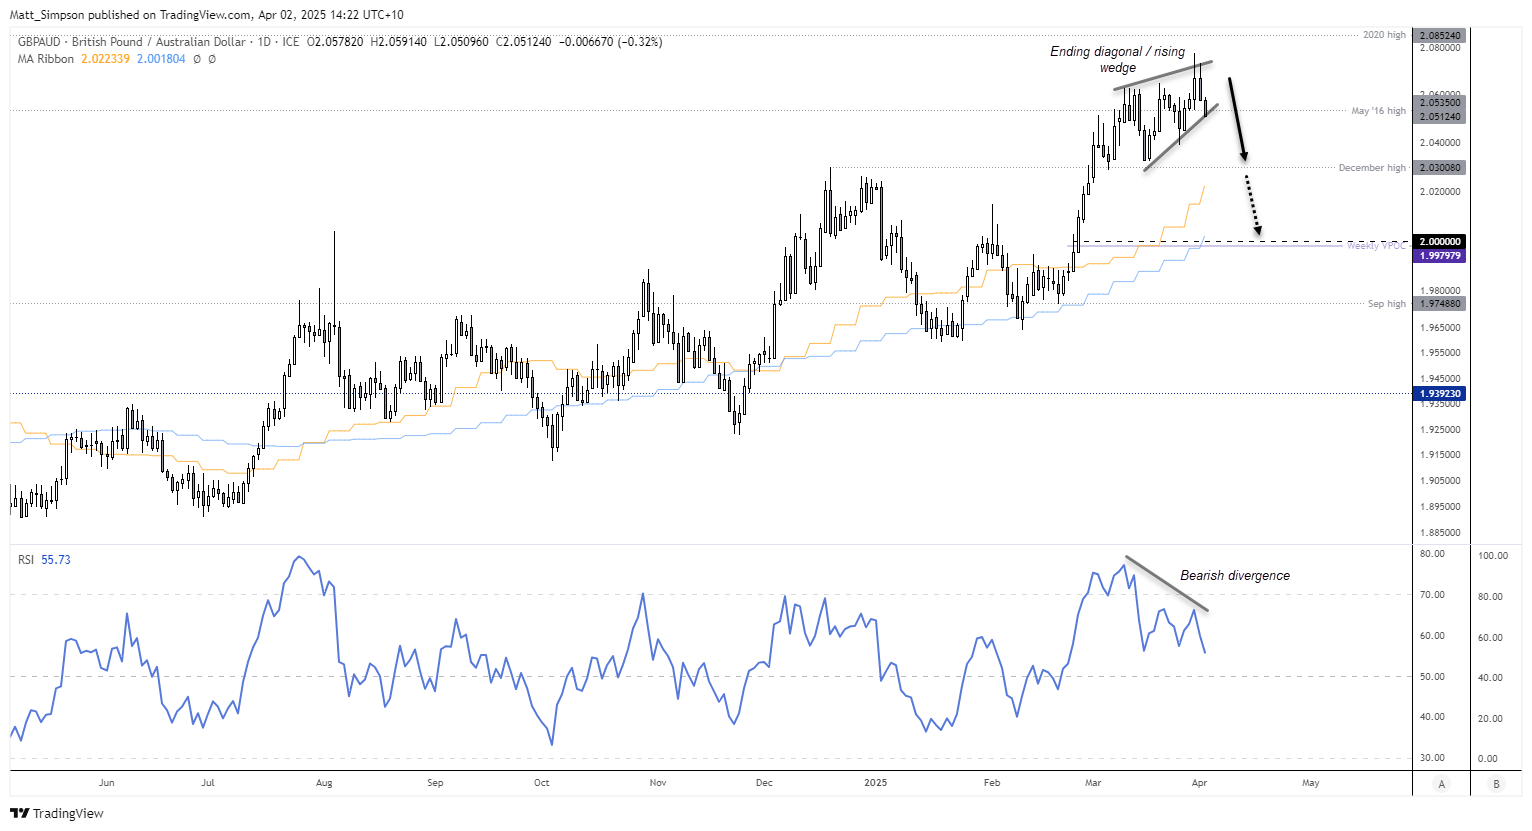
GBP/AUD Technical Analysis (Daily Chart)
I’ll admit that it may not be a textbook ending diagonal or rising wedge pattern. But I generally find that the textbook ones are not often successful, and it does serve the purpose of showing a lack of momentum after a strong move higher. Naturally, this has resulted with a bearish divergence with the daily RSI (14).
- My bias remains bearish while prices remain beneath the cycle high
- Bears could seek to fade into minor rebounds towards the 2.06 area, or somewhere within yesterday’s
- The wedge suggest an initial downside target near the patterns base and December high, a break beneath which brings the 10 and 20-week SMAs and 2.0 handle into focus.
-- Written by Matt Simpson
Follow Matt on Twitter @cLeverEdge
How to trade with City Index
You can trade with City Index by following these four easy steps:
- Open an account, or log in if you’re already a customer
• Open an account in the UK
• Open an account in Australia
• Open an account in Singapore
- Search for the market you want to trade in our award-winning platform
- Choose your position and size, and your stop and limit levels
- Place the trade



Open an account in minutes
Experience award-winning platforms with fast and secure execution, and enjoy tight spreads from 0.5 pts on FX and 0.3 pts on indices.
Economic calendar
Web Trader platform
Our sophisticated web-based platform is packed with features.
Related articles

USD/JPY Forecast: Is Rising Japanese Inflation Supporting the Yen?
As the trading week comes to an end, one of the most relevant developments in the FX market has been the renewed strength of the Japanese yen. This can be seen in the recent performance of USD/JPY, which has fallen nearly 1.0% over the last two trading sessions, highlighting a meaningful recovery in the Japanese currency against the U.S. dollar.


Australian Dollar Forecast: AUD/USD Support Reversal Sparks Monthly Range Breakout 10 23 2026
A sharp reversal off key support has fueled the AUD/USD recovery, with resistance now in focus ahead of next week’s Fed decision and Australian CPI.

S&P 500 forecast: AI linked stocks remain under pressure
And just like that, it is Friday again and the end of a volatile week. Today offers little on the macro calendar to change the prevailing narrative, leaving markets largely at the mercy of risk appetite, oil prices and the growing unease around the AI trade.

This report is intended for general circulation only. It should not be construed as a recommendation, or an offer (or solicitation of an offer) to buy or sell any financial products. The information provided does not take into account your specific investment objectives, financial situation or particular needs. Before you act on any recommendation that may be contained in this report, independent advice ought to be sought from a financial adviser regarding the suitability of the investment product, taking into account your specific investment objectives, financial situation or particular needs.
StoneX Financial Pte. Ltd., may distribute reports produced by its respective foreign entities or affiliates within the StoneX group of companies or third parties pursuant to an arrangement under Regulation 32C of the Financial Advisers Regulations. Where the report is distributed to a person in Singapore who is not an accredited investor, expert investor or an institutional investor (as defined in the Securities Futures Act), StoneX Financial Pte. Ltd. accepts legal responsibility to such persons for the contents of the report only to the extent required by law. Singapore recipients should contact StoneX Financial Pte. Ltd. at 6826 9988 for matters arising from, or in connection with the report.
In the case of all other recipients of this report, to the extent permitted by applicable laws and regulations neither StoneX Financial Pte. Ltd. nor its associated companies will be responsible or liable for any loss or damage incurred arising out of, or in connection with, any use of the information contained in this report and all such liability is hereby expressly disclaimed. No representation or warranty is made, express or implied, that the content of this report is complete or accurate.
StoneX Financial Pte. Ltd. is not under any obligation to update this report.
Trading CFDs carries a high level of risk that may not be suitable for some investors. Consider your investment objectives, level of experience, financial resources, risk appetite and other relevant circumstances carefully. The possibility exists that you could lose some or all of your investments, including your initial deposits. If in doubt, please seek independent expert advice. Visit www.forex.com/en-sg/terms-and-policies for the complete Risk Disclosure Statement.