


Gold Price Outlook: Dead Cat Bounce Risk as Bearish Signals Build
Gold prices attempt to stabilise, but weak technicals and bearish options positioning warn the bounce may fade with 4,000 support in focus.
Share this:

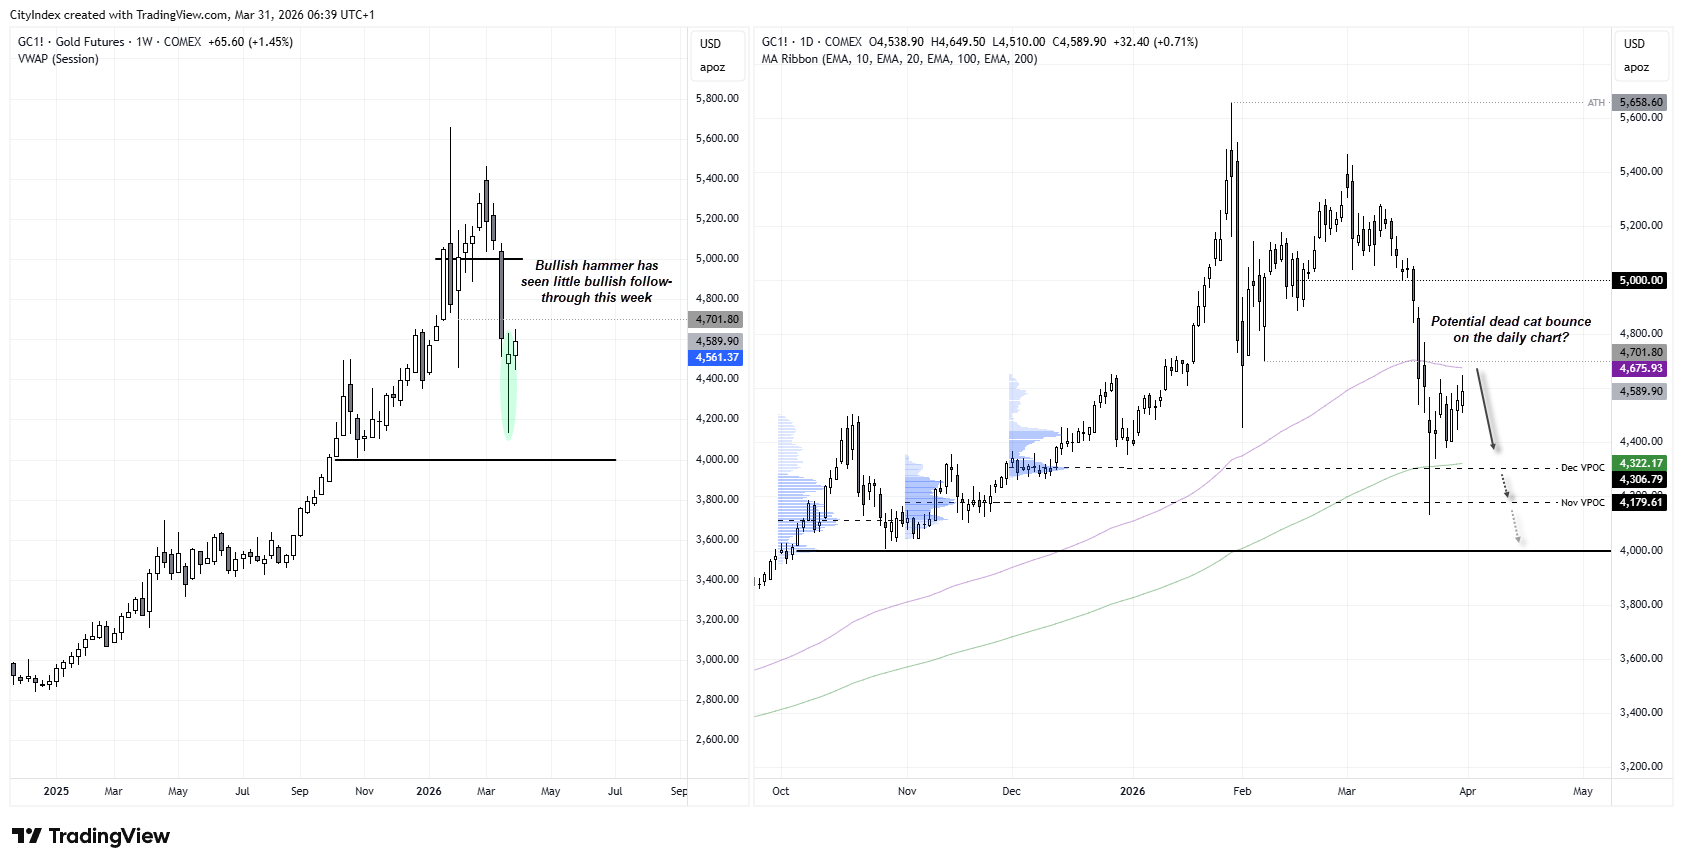
Gold prices are attempting to stabilise after a sharp selloff, but the recovery lacks conviction. While a bullish hammer on the weekly chart hinted at support, follow-through has been weak and price action on the daily timeframe points to a potential dead cat bounce.
At the same time, options markets continue to lean bearish, with traders favouring downside protection despite the recent rebound. With oil prices elevated, geopolitical uncertainty lingering and the US dollar holding firm near highs, the macro backdrop is hardly supportive for a sustained rally.
Unless a clear risk-on catalyst emerges, gold’s upside may remain limited—leaving the 4,000 level as a key downside target for traders.
View related analysis:
- Dead Cat Bounce Explained: How False Rallies Form in Downtrends
- US Dollar Hits 11-Month High, GBP/USD Breaks Support, FX Signals Mixed
- FX Futures Positioning: US Dollar, EUR/USD, USD/JPY | COT report
- Australian Dollar Outlook: Geopolitics and US Data to Drive AUD/USD Volatility
- AUD/USD Outlook 2026: Key Drivers for the Australian Dollar in Q2
Gold Price Analysis: Bearish Signals Build as Dead Cat Bounce Emerges
Macro Drivers: Oil, Geopolitics and Risk Sentiment
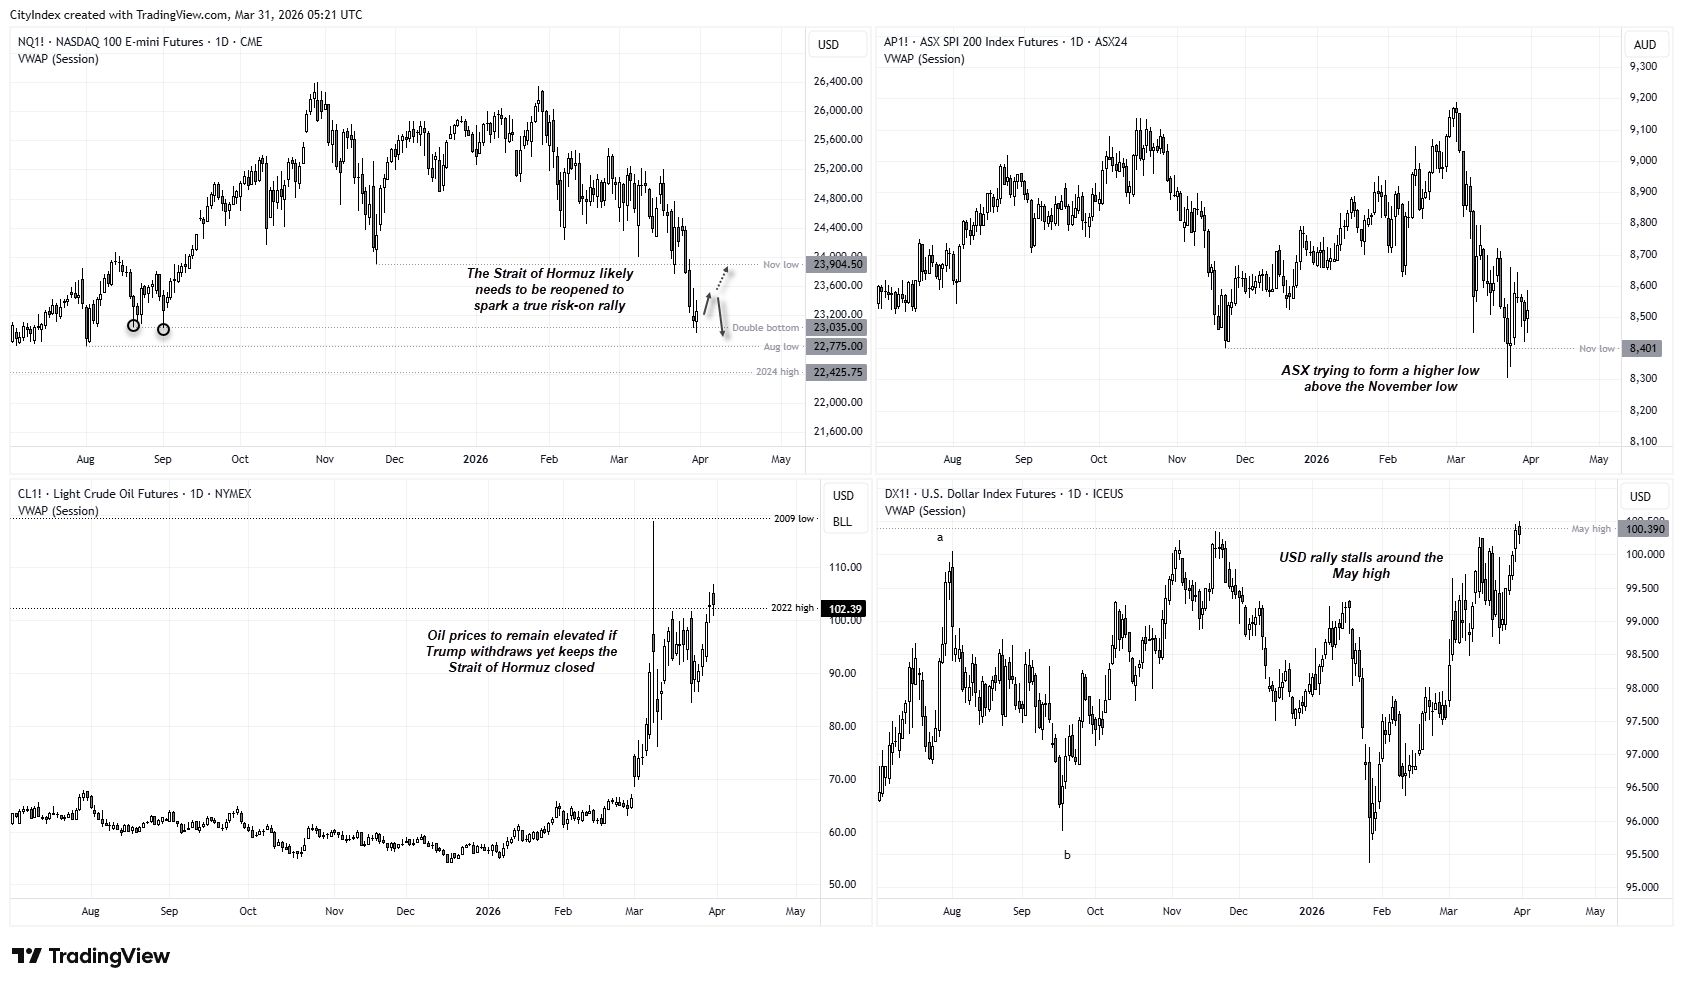
Risk received a minor boost during Tuesday’s Asia session following headlines that President Trump had told aides he was considering ending the war on Iran. Yet the major caveat that kept a lid on a true risk-on recovery is that he is considering doing so without reopening the Strait of Hormuz.
We can speculate whether this is a test balloon to gauge reaction or a failed attempt at a genuine pump. But if true, it would be deemed a massive own goal by President Trump, as it means the only tangible outcome would be persistently high oil prices and an incoming wave of inflation.
We’ll wait for further details to emerge. But the fact such headlines are even surfacing should raise concern, because from where I’m sitting, Trump has effectively signalled he has a weak hand—regardless of whether he had a strong one to begin with.
Source: CME, ASX20, NYEX, ICE, TradingView
Market Snapshot: Equities Firm, Oil Elevated, Gold Bounce Lacks Conviction
- Wall Street futures are higher, with the Dow Jones (0.8%) leading the way ahead of the Nasdaq (0.74%) and S&P 500 (0.64%)
- The Nasdaq is trying to hold above the double bottom that formed in August, though a break of today’s low brings the August low into focus
- Nikkei futures are effectively flat after handing back its 2% gains on the headlines earlier
- SPI 200 (ASX 200 futures) are up 0.6%, though it does seem to be trying to carve out a higher low above the November low – though a genuine risk-on signal is required to help it rally from here
- WTI crude oil is down -0.14% and handed back the day’s prior gains, though prices remain elevated without little chance of the global oil supply being replenished any time soon
- Gold futures are up 0.8% on the day, though the recent lacklustre performance from bulls could suggest a dead cat bounce could be playing out to indicate another leg lower

Gold Futures (GC) Technical Analysis
Weekly Chart: Bullish Hammer Fails to Inspire Follow-Through
The weekly chart shows that gold’s rapid selloff was halted by an elongated bullish hammer last week. Given gold fell in tandem with Wall Street sentiment, we could expect investors who flocked to cash to return from the sidelines and bid gold alongside stocks should a risk-on trigger emerge. I’m just not convinced we’re set to see a meaningful one yet—unless President Trump somehow reopens the Strait of Hormuz. I therefore see any near-term upside for gold as limited.
Note we’re yet to see prices fall to 4,000—its next major support level for bears to target or bulls to view as a discount.
Daily Chart: Dead Cat Bounce Taking Shape
The daily chart shows a potential dead cat bounce forming, with choppy price action grinding higher in a lacklustre fashion. While a solid bullish pinbar helped prices rebound above the 200-day EMA, bulls are struggling to retest the 100-day EMA or the 4,700 handle—a level that could cap as resistance or tempt bears to fade the move.
And if Wall Street suffers another blow, gold prices could track lower and see momentum accelerate back towards the 200-day EMA. A break beneath it would bring the 4,179 volume point of control (VPOC) and the 4,000 handle back into focus.
Source: ICE, TradingView

Gold Options Positioning: Bearish Skew Signals Downside Risk
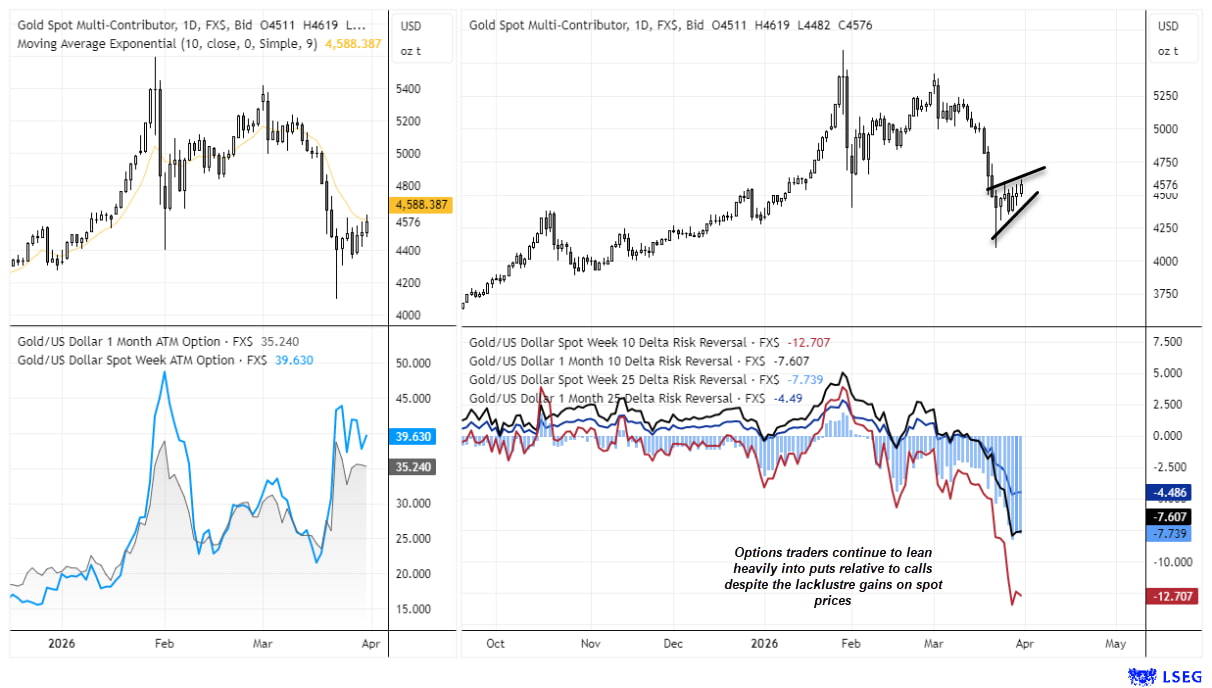
Options traders aren’t ‘buying’ into the recent bounce in gold. Risk reversals remain firmly negative, which tells us traders are still paying up for puts over calls—basically hedging against further downside. At the same time, implied volatility has picked up again, suggesting markets expect bigger moves ahead. But importantly, that volatility is skewed to the downside.
Ultimately, spot prices are trying to stabilise yet options traders are still positioning for weakness
That divergence is worth paying attention to. It often shows up before the next directional move—and right now, options markets are leaning bearish.
Source: COMEX, LSEG
View the full economic calendar
-- Written by Matt Simpson
Follow Matt on Twitter @cLeverEdge



Open an account in minutes
Experience award-winning platforms with fast and secure execution, and enjoy tight spreads from 0.5 pts on FX and 0.3 pts on indices.
Economic calendar
Web Trader platform
Our sophisticated web-based platform is packed with features.
Related articles

Gold Does Something it Hasn’t Done in a Year, is Larger Risk-Off Afoot?
With tech stocks getting hit harder last week there was collateral damage elsewhere, including gold as the metal closed below the $4k level for the week and that’s the first time that’s happened to spot gold in more than a year.


Silver forecast: metals liquidation drags XAG/USD into $50-55 support
Silver has broken its July low and slipped into a long-term support zone as the selling in precious metals deepens. The chart shows where the metal could bottom, and next week's Fed decision may decide whether it does.


Crude Oil Forecast: Weekend Iran Strike Fears Lift Oil Toward War Highs
Brent crude oil is accelerating above $110 as traders price in the risk of a US-Israeli strike on Iran over the weekend. How much more of a geopolitical premium can oil build in before the close?

This report is intended for general circulation only. It should not be construed as a recommendation, or an offer (or solicitation of an offer) to buy or sell any financial products. The information provided does not take into account your specific investment objectives, financial situation or particular needs. Before you act on any recommendation that may be contained in this report, independent advice ought to be sought from a financial adviser regarding the suitability of the investment product, taking into account your specific investment objectives, financial situation or particular needs.
StoneX Financial Pte. Ltd., may distribute reports produced by its respective foreign entities or affiliates within the StoneX group of companies or third parties pursuant to an arrangement under Regulation 32C of the Financial Advisers Regulations. Where the report is distributed to a person in Singapore who is not an accredited investor, expert investor or an institutional investor (as defined in the Securities Futures Act), StoneX Financial Pte. Ltd. accepts legal responsibility to such persons for the contents of the report only to the extent required by law. Singapore recipients should contact StoneX Financial Pte. Ltd. at 6826 9988 for matters arising from, or in connection with the report.
In the case of all other recipients of this report, to the extent permitted by applicable laws and regulations neither StoneX Financial Pte. Ltd. nor its associated companies will be responsible or liable for any loss or damage incurred arising out of, or in connection with, any use of the information contained in this report and all such liability is hereby expressly disclaimed. No representation or warranty is made, express or implied, that the content of this report is complete or accurate.
StoneX Financial Pte. Ltd. is not under any obligation to update this report.
Trading CFDs carries a high level of risk that may not be suitable for some investors. Consider your investment objectives, level of experience, financial resources, risk appetite and other relevant circumstances carefully. The possibility exists that you could lose some or all of your investments, including your initial deposits. If in doubt, please seek independent expert advice. Visit www.forex.com/en-sg/terms-and-policies for the complete Risk Disclosure Statement.